Grid scale projects in California and net grid demand

My Nissan Leaf Forum

Help Support My Nissan Leaf Forum:

This site may earn a commission from merchant affiliate links, including eBay, Amazon, and others.

tbleakne

Well-known member
Leaf Supporting Member
Joined
Jul 28, 2010
Messages
988
Location
Claremont, CA
When I first got my LEAF, and folks asked me about my carbon footprint, I told them that by charging after midnight in CA my car was often drawing surplus wind power. I could claim my carbon footprint for charging in my garage was near zero.

With the advent of the large new grid-scale solar projects in the desert the last few years, including the monster thermal tower project at Ivanpah near the NV border and Primm, the daily production curves are showing dramatic change. CAISO (California Independent System Opeator) is now talking about the Duck Curve, which plots the expected difference between total load and production from variable production sources, including solar and wind:

ISO-NetDemandDuck-L.jpg


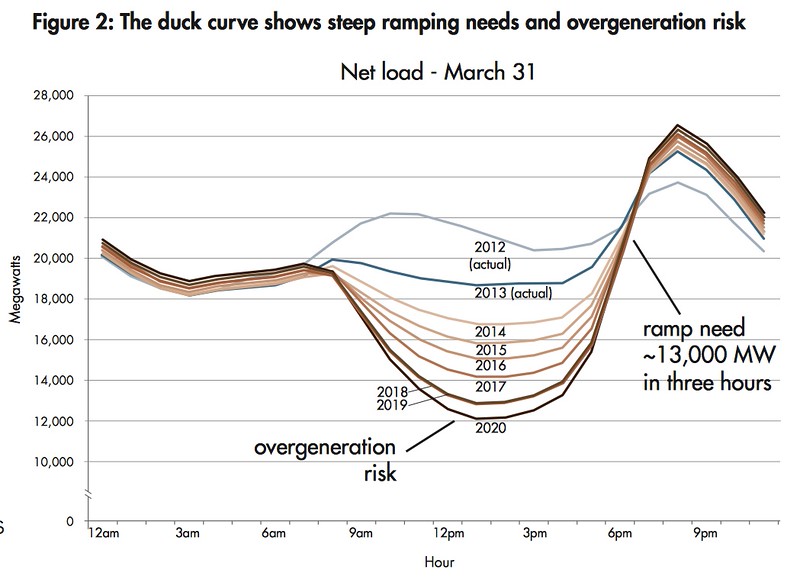
The total production of grid-scale solar in CA is now over 5 GW for several hours near midday. Much of the grid-scale solar tracks the sun, so it has a nearly trapezoidal power distribution that ramps up rapidly in the morning and declines rapidly in the late afternoon. Our own individual residential solar adds another 1.2GW of capacity, plus about 1 GW of non-utility commercial solar installations, but CAISO sees these latter two only indirectly as reduced demand from its member utilities. These non-grid-scale installations are mostly non-tracking, so their power curves are more bell-shaped.

CA has well over 5 GW of installed wind power capacity, but because the winds are variable, production often peaks at less than 1.5 GW.

More grid-scale solar is planned for CA, but projected increases in wind power are much more modest. The reverse is true on the national scale, where wind power has jumped to an impressive 4% of total production in just a few years. Wind is over 25% of Iowa's production (but 60% is coal).

The above graph projects that conventional production, which is now largely natural gas, will often reach a minimum in the afternoon, not overnight. However, the example shown is for March, and total demand in the summer is higher, typically 45 GW, so the summer minimum may still occur at night.

My conclusion is that for at least part of the year the lowest-carbon time to charge our cars may move to late morning or afternoon. It will be interesting to see if and when incentives are tilted in that direction. EVs used for commuting will need a lot more charging available at work locations.

CAISO is worried that it will be difficult for the sources it controls to ramp up and down to match the Duck Curve. Eventually with deep solar supply we are going to need grid-scale storage, which I will discuss in another post.
 
Need battery storage to move available solar from the belly to the head.
Really going to alter the TOU pricing with off-peak being closer to noon and shift on-peak to 7p to 11p. Could hurt home solar payback unless battery is included.

Issues with over generation and ramp up is probably overrated. JMHO.
 
Grid-scale Storage Summary

As discussed in my previous post, GW of grid-scale storage are needed to work with wind and solar generation.

As EV drivers, we think batteries first, but we know how expensive batteries are. They have high efficiency, fast response, but limited lifetimes. California currently has 50K+ BEVs and 40K PEVs. If we assume that each car could supply an average of 10kWh at 10kW, 1 hour, we would have just short of 1 GW. Realistically few owners would be willing to subject their cars to 10kWh of daily cycling, but when their batteries are retired from their vehicles, we might have .6 GW of available grid storage.

Nationally, just several years ago, 99% of grid-scale storage was pumped hydro, where you pump water uphill to store energy and run it downhill to release it. You need two reservoirs close together separated by substantial altitude difference. There had been no new pumped hydro projects initiated for 20 years.

The efficiency of pumped storage is typically 80%, but new proposals claim 90+% is achievable.

The simplest way to use hydro storage like a battery is to modulate the flow of water through a dam, higher flow when demand and the price is high, lower or no flow off-peak when the price is low. The efficiency of this strategy is 100% and the only cost is the impact of variable flow on downstream uses of the water, so this has been common practice at many dams for a century or more.

Pumped hydro projects have two versions: Open Loop, and Closed Loop. Open Loop operates in contact with an existing water source, such as a reservoir and dam. To add pumped storage you provide a lower reservoir, pump, and pipe back up to the original higher reservoir. The cost is low, water is available, and the additional evaporative loss can be minimal. Closed Loop operates without an associated water source. This means two reservoirs have to be built, water purchased, and evaporative loss is now an additional concern. The addition of open water to an area that did not have it can lead to ecological concerns.

With the dramatic growth of wind generation in the midwest, and growth of solar in California and other states, FERC has this Fall 2014 map of new pumped storage projects, including almost 10 GW for California:

issued-permits.pdf


In addition, other technologies are now being considered for new grid-scale storage.

CAES, compressed air energy storage, uses large underground caverns such as abandoned mines. It has suffered from a relatively low efficiency, because the compression usually is isothermal, not adiabatic, so heat is lost between the compression and subsequent expansion. New technology promises to reduce this loss.

GridStoragePie-L.jpg


A 20MW flywheel project became operational in 2014 in PA. It is used for short-term, fast-response frequency regulation:

Beacon.pdf


In the bottom image each blue dot is the top of a flywheel unit, .1MW each. They are installed below ground level for safety in case one explodes.
 
Way back in the mid to late 90's during the "boom" I was doing alot of these types of installs. One company that was popular at the time was ActivePower which was a flywheel based UPS company owned by Caterpillar then. http://www.activepower.com/flywheel-technology/

The size of these installs were massive (especially for California and seismic zones) but to see a 3 to 10 ton flywheel running at 5k rpm totally silent in a partial vacuum chamber is pretty cool.

I'm surprised that grid and power companies haven't started to use this idea sooner.
 
JeremyW, it took me several days, but I watched all of your presentation to the BayLeafs? An amazing amount of good information, and it sounds like you had a good audience patient enough to sit through the full 2+ hours. Too bad the camera was not better oriented toward the screen.

You mentioned how the demand now favors solar on SW roofs over south roofs. I have observed a growth in installations even on east and/or west roofs. Although the production efficiency is lower, with the lower cost of panels, apparently the payback is still acceptable, and the utility should like the wider production window.

Perhaps not soon, but some day when solar becomes even more widespread, it might be economic to send power west one time zone first thing in the morning and east one time zone in the late afternoon in order to cover more of the demand in these time periods.
 
Well the actual shape of the duck curve is slightly different than the one shown in the OP. Here is the current curve from CaISO. Notice that the mid-day net demand is very close to AT OR BELOW the night-time demand. I've been watching this periodically waiting for the day. So, instead of charging our EVs at night to get the cheapest rates, soon the grid folks may change TOU and offer cheaper rates between 10am and 2pm.

http://www.caiso.com/Pages/TodaysOutlook.aspx#Renewables
duck.gif
 
+1. SCE picked the March time frame to display its "Duck Curve" because that is the time of year when the difference between mid-day load and mid-day solar generation is maximum, for the most dramatic effect. Later in the summer the mid-day load will go to 45 GW or more and the solar generation will be more, but proportionally less, so the curve will be smoother.

I agree at some point they should change the incentives to encourage daytime charging. Workplace charging could be offered a discount.
 
I recently saw a comment that explains better for me why many utilities in other states dislike solar. While those of us with residential solar see ourselves as helping the utility when the grid is stressed during mid-day summers, the generation component of utilities likes the on-peak time, because that is when they can get maximum wholesale price for their generation.

If solar takes a big chunk out of the net demand at the highest-priced time of the day, the economics of their fossil fuel generation declines. Of course that is exactly what should happen to reduce carbon footprint, forcing fossil fuel plants to be retired. Even in TX some of the least efficient coal generation plants are being retired, but there is very modest amount of solar in TX, so the competition is coming more from wind and natural gas.
 
Reddy said:
Well the actual shape of the duck curve is slightly different than the one shown in the OP. Here is the current curve from CaISO. Notice that the mid-day net demand is very close to AT OR BELOW the night-time demand. I've been watching this periodically waiting for the day. So, instead of charging our EVs at night to get the cheapest rates, soon the grid folks may change TOU and offer cheaper rates between 10am and 2pm.

http://www.caiso.com/Pages/TodaysOutlook.aspx#Renewables
duck.gif

YES! very different. Typical doomsday prediction. 2014 and 2015 should have had the mid-day belly lower than the overnight low. Failed to happen.
If we continue on the path to 2018 it looks like the belly could actually match the overnight low. Far from being an 'over generation issue' anytime soon.
 
tbleakne said:
If solar takes a big chunk out of the net demand at the highest-priced time of the day, the economics of their fossil fuel generation declines.

The highest priced time of day becomes the evening and to a lesser extent the night.
 
Good Grid Scale news: coal mining and coal power generation are declining dramatically.

As EV drivers we expect our investment to help show the way to reduced carbon footprints. Although many of us have solar, we also use the grid, so the carbon footprint of our local power generation is important.

When the LEAF first appeared 4 years ago, a few critics said “you are driving on coal.” It had been true that 50% of total US electric generation came from coal, but the percentage varied widely by state. In 4 states the percentage was over 90%. Even Los Angeles DWP had been buying 50% of its power from coal plants in neighboring states.

Today we all are aware that fracking has led to a surge in natural gas production in the US that has undercut the price of coal. Natural gas has its own environmental problems, and hopefully it too can eventually be replaced, but this post is about coal.

————————————
A recent piece in the NY Times has highlighted how really dramatic and rapid has been the impact on coal mining.
http://www.nytimes.com/2015/08/07/b...-wobbles-as-market-forces-slug-away.html?_r=0
A few key quotes:
Alpha Natural Resources, the nation’s fourth-largest coal producer after it doubled down on coal four years ago in acquiring Massey Coal for $7.1 billion, filed for bankruptcy protection on Monday.
>>>>>
The demise of the two biggest surviving publicly traded coal companies — Peabody Energy and Arch Coal, the nation’s two largest producers — may just be a matter of time, based on their recent stock performance. Peabody shares, which traded at more than $16 less than a year ago, hit 99 cents this week, and Arch shares have fallen to $1 from more than $33, making them among the biggest losers this year in the Standard & Poor’s 500-stock index.
>>>>
Coal prices have plunged about 70 percent in the last four years.
>>>>
Stanford University, which announced last May that it would divest itself of direct investments in coal producers, looks at least as much like a shrewd investor as an environmental steward, given the subsequent plunge in coal prices and coal company stock prices, and other big investors have taken notice.
>>>>>
“There are concerns about fracking, but it’s way better than cutting down mountains.”
————————————

Of the three types of coal mining in the US, mountain-top removal, underground, and surface, only surface mining in the West remains profitable.
From Bloomberg
http://www.bloomberg.com/news/articles/2015-04-16/most-u-s-coal-is-uneconomical-as-natural-gas-fattens-profits
On a spot basis, a power plant burning gas can make about $27 per megawatt hour, $10 more than coal units, data compiled by Bloomberg show.
>>>>
The only coal that makes sense for generators to burn is from a mine near a power plant or the cheapest varieties from Wyoming’s Powder River Basin, Levin said.
Unfortunately the huge Navajo generating station near Lake Powell falls into the first category, with its own private electric railroad to feed it from nearby surface mining on the reservation. California used to get quite a bit of power from this station, but now its share probably goes to Arizona.
http://www.scientificamerican.com/a...station-powers-and-paralyzes-the-western-u-s/
The Navajo station’s infernos gobble 15 tons of coal each minute, 24 hours each day, every day. [Almost 1000 tons per hour.]
>>>
Last year, the plant’s owners and their supporters negotiated a compromise with the EPA that will allow it to continue operating until 2044[bad].
————————————————-
Last year power generation in the US from coal was down to 39% of the total, but capacity representing another 7% is scheduled to be retired in 2015 , which is pretty dramatic. The decline would be faster, but coal generation is often sold under long-term contracts that take time or are expensive to sell or terminate. 7% of California’s electric mix still comes into the state from such contracts.

Cloud Peak Energy is the leading remaining viable coal company. It has had high ambitions to expand its export of cheap Powder River Basin coal to China, but China has been cutting its coal imports. Other Asian countries are still importing coal, but the quantities are less.

China’s total coal consumption is still enormous, but as its economy slows it is favoring domestic coal production over imports. It is also moving coal power generation away from its coast to mitigate pollution in populated areas, and only costal plants can economically import coal.
http://daily.sightline.org/2015/04/23/more-headwinds-for-coal-exports/
http://ieefa.org/2015-is-looking-like-2014-chinas-appetite-for-coal-continues-to-slow/
China has hammered away at coal imports. For the first three months of 2015, coal imports are down 42 percent year on year, a massive acceleration from the 11 percent decline reported for all of 2014. Peak coal consumption for China appears to have occurred in 2013, three years ahead of schedule even by IEEFA’s expectations.

What makes this trend so globally important is that:

• China represents 50 percent of the world’s consumption of coal and accounted for more than 20 percent of seaborne coal demand in 2014.
• India is looking to replicate China’s achievements in the transformation of its own electricity system as outlined in a government policy plan that emerged in 2014. India is set to account for 20 percent of the world’s seaborne thermal coal demand in 2015, and the scenario that sees the world’s two largest import markets collapse to zero by 2020 is rapidly gaining credibility.
 
A different and interesting “grid-scale” story from a Yale website, about the rise of Microgrids in Africa:

http://e360.yale.edu/feature/african_lights_microgrids_are_bringing_power_to_rural_kenya/2924/

In Kenya villages far from any electric grid, very small 5 watt solar + battery systems mounted on individual roofs are being supplanted by village-scale microgrids of 5 to 6 kW DC, supplying 64 customers through a central smart meter. Battery storage, type unspecified, stores 24 hours of production for nighttime use. Customers make deposits of credit, sometimes just a few cents at a time, via text messages from their cell phones. Once their credit is used up, the power goes off.

The story features a company called SteamaCo. More details about their technology:

https://www.ashden.org/files/case_studies/SteamaCo, Kenya.pdf

The prices quoted seem very high: $75K for the complete 5.6kW system, including solar panels, inverter, batteries, and SteamaCo’s controller system. The customers pay $2 to $4 per kWh. This sounds outrageous, but it is cheaper than kerosene for lighting.

However, a report from Reuters quotes a much more reasonable price for the same SteamaCo hub :
“With each solar microgrid system costing between $15,000 and $20,000, including distribution, SteamaCo intends to raise at least $1 million from equity funds to bring a new burst of life to other communities across East Africa.”

The result in each village is a rise in commerce and standard of living, more light for kids to study, and reduced carbon footprint compared to kerosene.

SteamaCo is probably using lead acid batteries, and their frequent need for replacement could be driving the high cost per kWh. One MIT spinoff company has just begun full-scale production of a cheap alternative battery for microgrids. The Aquino Aqueous Hybrid Ion technology, using saltwater electrolyte, is heavy and limited discharge rate, so it is not suitable for cars, but it is supposed to last twice as long as lead acid for the same price.

http://www.aquionenergy.com/energy-storage-technology
 
More on China, coal, and India:

From NYTimes:
“While the US EIA reports that China’s coal consumption continues to grow",
the Institute of Energy Economics and Financial Analysis has a much more optimistic report titled “Peak Coal in China” with some impressive numbers on carbon-free energy growth:

http://ieefa.org/wp-content/uploads/2015/11/IEEFA_Peak-Coal_November-2015.pdf

Before showing quotes from above, here are some US numbers for comparison:
Compare US:
15 GW solar, 7 GW in CA.
65 GW wind, 15 GW in TX
8 to 9 GW of both wind and solar being added this year

China has been rapidly diversifying away from its historic reliance on coal-fired power generation. China has undertaken a significant and sustained investment program in wind, solar, hydro, nuclear and gas-fired power generation. China recently lifted its expected 2020 solar installation target by 50% from 100GW to 150GW. IEEFA forecasts that wind and hydro electricity capacity additions could each exceed 20GW annually this decade. China is forecast to commission over 20GW of new nuclear facilities prior to 2020.

With China seemingly getting their act together, India now looms as perhaps a bigger threat to CO2 emissions, still planning to increase their coal generation. However, they also seem be committed to significant increases in solar:

http://www.theclimategroup.org/what...ive-to-core-energy-says-investor-uday-khemka/

“When Modi first came to power in the new government of last year he raised targets of the last government from 20 GW of power to 50 GW. Then within another few weeks from 50 GW to 100 GW and added another 75 GW of other renewable power sources.”
 
Need for more wind power in California to replace Natural Gas

The Porter Ranch methane leak disaster has substantially increased the carbon emissions footprint for the whole state and will impact the carbon budget for decades. It highlights the vulnerability that natural gas imposes on California's plans to cut carbon emissions.

Since the San Onofre Nuclear plant shutdown, CA has become more dependent upon natural gas generation. Natural gas is also the main swing producer to mitigate the variability of solar and wind. Natural gas is supposed to have a lower carbon footprint than coal, but this is somewhat controversial. Coal, being mostly carbon with little hydrogen, is nasty, but at least it does not leak.

Solar generation capacity in CA reached 11.5 GW in 2015, of which 3.5 GW was installed this year. At this pace CA will reach 20 GW of solar in several years. Wind power tends to peak in the evening and decline during the day, so it tends to complement the solar power daily profile. However, growth in wind power in CA, now at 6 GW, will not keep pace, because the best onshore wind sites are already taken. This means that the Duck Curve shown at the beginning of this thread in on track to get worse in the next few years, forcing larger daily swings in natural gas generation. If Porter Ranch forces a cutback in natural gas in CA, what low carbon alternatives can replace it?

1. Advanced nuclear.
2. Storage
3. Offshore wind, conventional.
4. Offshore wind, floating.
5. Inport wind power via new HVDC transmission lines from midwest.

1. Advanced nuclear. Not available on this time scale, cost and risks unknown, a big subject for another post. It can never be a complete solution because it cannot ramp up and down.

2. Storage. Batteries are the holy grail, but I believe their cost has to decline an order of magnitude to be viable at utility scale. I have covered hydro power storage in a post above on this thread.
http://www.mynissanleaf.com/viewtopic.php?f=25&t=19398#p415925

3. NREL has a map that shows that there is a lot of offshore wind power potential on the west coast, including CA.
awstwspd80onoffbigC3-3dpi600.jpg

Europe has about 9 GW of offshore wind power, with new expansion coming in the UK and the Baltic. It is high quality wind that blows more consistently than onshore wind.

The US currently has zero offshore wind, with one small wind farm under construction off the east coast. A major reason is that the Baltic sea and UK waters are shallow, while our coastal water is deep. Europe is also willing to pay the higher costs of offshore wind. The towers are more expensive to install, maintenance is more expensive, and transmission to shore is more expensive, but these costs are all coming down, approaching $.12/kWh, which is over twice what onshore wind can deliver in the US today.

On the map, Lake Michigan has obvious wind potential, and its waters are easily shallow enough. Political opposition has blocked this wind project for 5 years.
http://www.mlive.com/news/muskegon/index.ssf/2015/02/whatever_happened_to_offshore.html

4. Utility scale floating wind power is under advanced development. There are only a few operating floating wind turbines around the world. A university in Spain has patented a new floating design called WindCrete:

http://phys.org/news/2015-11-patent-low-cost-offshore-turbine.html

5. There is a proposed HDVC project that would deliver wind power from WY to a hub in Las Vegas, from which it could connect with the CA transmission grid.
http://www.transwestexpress.net
It would have a capacity of 3 GW for a price of 3 $bill, $1 per watt. DC lines have lower losses than AC and beyond a certain distance AC lines have too much reactive capacitance. It proposes 600kV, but state of the art today is 800 kV DC. There is also concern that in some states the political leadership is so hostile to renewable power that they would block the construction of such a transmission line over their territory. That is sad.

$1 per watt is not cheap, and this project has been "under development" since 2005. California would need several lines this large.
 
Stanford has an excellent paper on some details of off shore site potential in CA: https://web.stanford.edu/group/efmh/jacobson/Articles/I/Offshore/DvorakRenewEn2010.pdf

They suggest a site off the Humboldt Coast which, in summer, essentially looks like a base load power plant. Awesome! They do fail to mention the upstream upgrades necessary after connecting into the Humboldt Bay PG&E system, however. The load and lines in the area cannot support 1500 MW of new generation.

Still, I hope something gets built there in my lifetime. :)
 
Reddy said:
A really good, simple explanation of the duck curve for those that want an introduction:
http://www.vox.com/2016/2/10/10960848/solar-energy-duck-curve
Hopefully the next installment will talk about charging millions of EV's between the hours of 10am and 2pm and maybe even getting PAID to do it, just to keep the grid stable. :eek: Well, we can hope anyway. ;)
Thanks for that, an excellent article.
 
Yes, these are very good summaries of options for flattening the Duck Curve. Thanks.

Comment on one of the key strategies: increased long-distance transmission.
Despite significant wind turbines in place, there is still an abundance of untapped wind power in Wyoming, South Dakota, and nearby states. South Dakota power could be sent east to Chicago, and Wyoming power could be shipped to southern California. However, these states currently also burn a lot of coal, which is very cheap because it is local and strip mined. They could first increase their own consumption of wind power with only local transmission.

Quote from article above:
getting high-voltage transmission lines built is extremely difficult and time-consuming
There is one organized proposal for Wyoming, a HVDC line to Las Vegas, TransWest Express:
http://www.transwestexpress.net
This project has been "under development" since 2005, more than 10 years. Its projected cost for 700 miles is $3B for 3GW, 1$ per watt, an easy number to remember. For comparison, I saw a price for an onshore wind project of $1.5/watt, probably out of date, and the latest large grid-scale solar projects are coming in at just a little over 1$/watt. So delivering WY wind power to southern California could cost about twice what local grid-scale solar generation costs.

Of course the value of transmitting WY wind power 700 miles is that it would produce power at times complementary to west coast solar production, helping to flatten the duck curve.
 
Back
Top