


evnow
Well-known member
I've been tracking the starting and ending SOC units for almost all trips in the last couple of months. What I've noticed is that ... at the top end, SOC units have less energy than in the middle esp. the 280 to 270 band has little actual energy compared to say 230 to 220. I don't have done enough data at the bottom end to draw any conclusions.
The following shows the Wh/SOC unit calculated using the average of the starting and ending trip SOC units (the denominator). The actual energy used is calculated as miles drives / mpkwh (this is the numerator). The Wh/SOC should be around 75 (21,500/281 or 21,000/281) if the SOC units were linear.
We see quite a bit of variability - between 40 & 110 Wh/SOC. But the trend shows the Wh/SOC going down as the SOC # goes up.
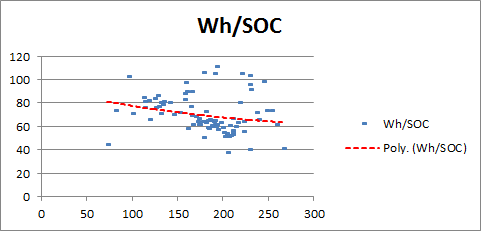
I wonder whether we should consider this when displaying the SOC %.
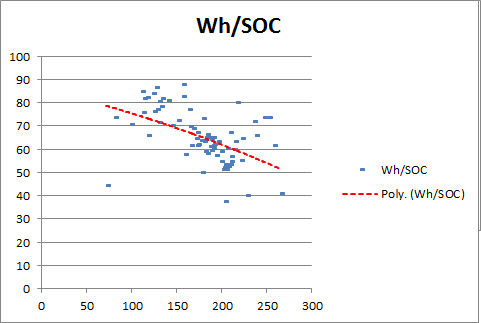
ps : By eliminating outliers we get ...
My guess is, when the SOC # is below 100, the Wh/ SOC again goes down.
The following shows the Wh/SOC unit calculated using the average of the starting and ending trip SOC units (the denominator). The actual energy used is calculated as miles drives / mpkwh (this is the numerator). The Wh/SOC should be around 75 (21,500/281 or 21,000/281) if the SOC units were linear.
We see quite a bit of variability - between 40 & 110 Wh/SOC. But the trend shows the Wh/SOC going down as the SOC # goes up.
I wonder whether we should consider this when displaying the SOC %.
ps : By eliminating outliers we get ...
My guess is, when the SOC # is below 100, the Wh/ SOC again goes down.


