edatoakrun
Well-known member
A few months after I got got my LEAF, with about 3,300 miles on the odometer, I decided to use a range test from a 100% charge to near the VLBW, to try to determine how driving variables effect energy use, and changes in range and/or battery capacity over time. After I realized that Carwings was updated and reporting consistently, I could further correlate range to actual kWh use, and battery capacity. When testing, I log speed, capacity bar disappearance (and appearance) , battery warnings, and (more recently) temperature. I would suggest any LEAF owner only interested in tracking battery capacity, just watch the total kWh use reports, to provide more precise information than provided by the dash displays.
I do not have a gid meter or other SOC indicator (not that there’s anything wrong with that) If you do have or will get one (Leafscan?) you could, of course, also analyze your kWh use and capacity by that, or other methods.
But my suggestion would be that you can simply use Carwings, for data of total kWh use between whichever initial charge % and charge end point you select. Any inaccuracies in the CW reports, IMO, are probably not nearly as significant to accuracy, as other variables, such as the “100%” charge level, the battery warnings levels, and unknown battery temperature effects, to name just a few.
About another 6,500 miles and nine months after my first range test, and after repeated tests in different conditions, I feel certain that my capacity loss is fairly small. Perhaps the largest variable remaining, is battery temperature when charging. Unfortunately, IMO, we have not gathered sufficient data to understand the larger amount of total battery capacity accepted by a warmer battery, and how much, and at what high temperature, the total charge may begin to be limited, temporarily or permanently, by the charge management system.
My earliest range test, on a hot Summer afternoon:
On 9/7/11.... When I reached my driveway, at 87 miles, I still had (less than) one bar, so I drove until I got the "very low battery" warning and simultaneously lost the last bar, at 91.5 miles. I got home with 93.4 miles, and between 5,500 and 6,000 ft. of ascent and descent, at an average speed of about 40 mph (those last 6.4 miles were up and down a hill at low speed). Since the last 1.9 miles after the "very low battery” warning were at about 20 mph and required about 150 ft. net descent with regen, I was probably still very close to the VLBW point capacity, when I parked.
According to CW, on this drive I used 18.7 kWh to drive 91.1 miles at average energy economy of 4.9 m/kWh.
I rechecked 2 other recent drives of 85-105 miles and each time CW has erred, under-reporting distance traveled, as compared with both my odometer and Google Maps, by 2.5%, +/- 0.1%....
Extrapolating from the chart, it appears CW may be saying the 1.7 kWh (8.5% from the chart, of 20.4 total kWh-anyone have a better number?) I had left at or near VLBW implies total available battery capacity of about 20.4 kWh.
http://www.mynissanleaf.com/viewtopic.php?f=31&t=5423&hilit=carwings+update&start=10" onclick="window.open(this.href);return false;
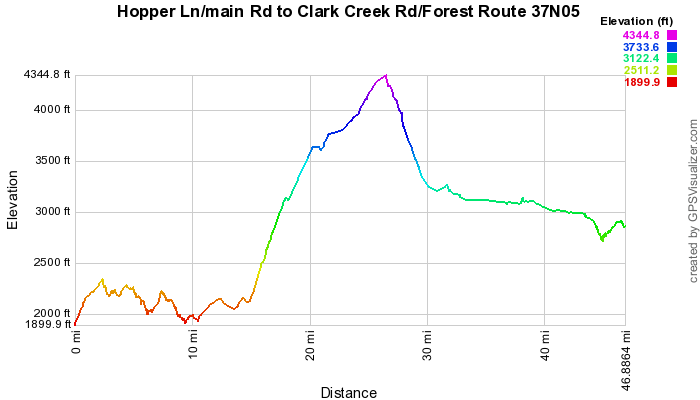
This drive was over the first 44 miles of this trip profile below, returning on the same route, with the added miles by repeating the first few miles.
On 5/31/12, I repeated the same drive, under similar hot weather conditions, covering the entire profile, with a second short loop added at the end, which totaled 47 miles by the odometer. I repeated ~miles 2-4 a half dozen times at the end till I got the VLBW, and including these miles and about 0.7 mile and about 200 ft. of altitude not on the Map, I drove 104.2 miles, to VLBW, and 105.8 miles in total, by odometer, including, I estimate, between 5,500 to 6,000 ft. of both ascent and descent..
I was not trying to replicate speed or other factors leading to my earlier m/kwh performance on this trip, just trying to find the kWh capacity between 100% charge and the same end point, about the the same short trip home (I now believe that to be about 0.2 kWh, of use, BTW) past the VLBW. I was also shooting for over 100 miles, so that I can now answer “how far..?”, with “106 miles, including a mile of up, over Hatchet MT summit, both ways”.
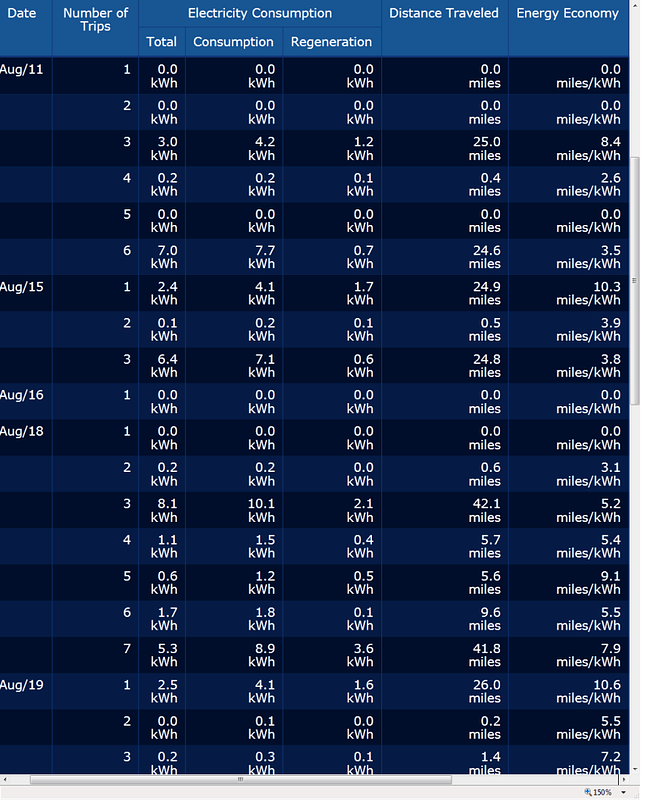
CW report for the 5 “trips” (# 4 is a just a start/stop cycle) is:
trip total Consum regen distance energy econ
1 8.8kWh 10.8kWh 2.0kWh 42.6miles 4.8miles/kWh
2 0.4kWh 0.7kWh 0.3kWh 3.3miles 8.6miles/kWh
3 0.6kWh 0.8kWh 0.2kWh 3.3miles 5.3miles/kWh
4 0.0kWh 0.0kWh 0.0kWh 0.0miles 0.0miles/kWh
5 7.7kWh 11.3kWh 3.6kWh 54.0miles 7.0miles/kWh
I expected higher m/kWh, as my additional miles were all low speed, and relatively level (see trips #2 and #3 above) as opposed to the ~20 miles both way of 55 mph highway over the high pass, in the middle of this trip. When I got the CW report, which is 17.5 kWh, 5.9 m/kWh, and (uncorrected) 103.2 miles, I was initially surprised by the high m/kWh, and somewhat disappointed by the low kWh capacity, which could indicate about 6% (1.2 kWh) capacity loss over this period. However, I searched my old posts, and found a partial explanation, in this low temperature report, of the same test route.
On (corrected date-9/7/11) the overnight low was in the low 60’s, and the top off was done when the ambient temp had warmed to the mid 80’s , and my best estimate that the battery was probably in the 70’s at this time. The drive was done in temperatures of 80-95 degrees. I believe (but did not record) that the battery temp indicator remained at 6 bars for the entire trip...When I made the (almost) identical drive on 11/8 of 88 miles (85.9 as reported by CW) CW reported 17.6 kWh consumed and 4.9 m/kWh. I believe my total battery capacity when I left home with a 100% charge was probably close to 19.4 kWh.
http://www.mynissanleaf.com/viewtopic.php?f=31&t=6701&start=60" onclick="window.open(this.href);return false;
I’m on PG&E E9A TOU rate now, and on 5/31/1 I charged from 80%-to 100% before 7:00 AM, at ambient temperature about 20-25F lower than I had on 9/7/11. I was still at 5 bars temp when I began the days drive on the afternoon of 5/31 at near 90 F ambient, but got a 6th bar within a few miles.
I had forgotten I had charged just before I drove, at much higher temperature, on the first test, on 9/7/11.
Oops.
My other observations have led me to believe that this cooler ambient charge temperature might be expected to reduce kWh capacity by about (?) 3%, so my total loss could be more like 3%, more or less, with the many other unknown uncertainties. I have several reports of 60-something F ambient charges, leading to 17.-something kWh capacity, but have none at a significantly higher temperature, since last summer.
I probably will try one more test, when the temp get back to the 90’s, and then wait till later in the day, to charge to 100%, and hope to get somewhere closer to the 18.7 kWh I got last year.
6/18 edit-Yesterday, 110.9 miles to VLB, 112.7 in total, by the odometer, with close to 6,000 ft of ascent and descent.
I think (and hope) my battery capacity is still so close to “new” (the initial test was after about 3,300 miles, and several Summer months) that it may be a while longer, before I can find a significant loss in capacity, by this method.
However, if you suspect you have a significant loss of capacity, say the “15%” the 12th bar loss is reported to show, I think a range/kWh test, such as this, would be very useful, as a capacity loss of that order, should show up above the other “noise” of range-affecting factors.
6/22 edit:
Revised title from previous "Range test-determine initial/reduced LEAF battery capacity"
8/1/12 edit:
Here is an updated one-way trip profile, showing the miles I have since added at the end, after it became clear my original course was not long enough.
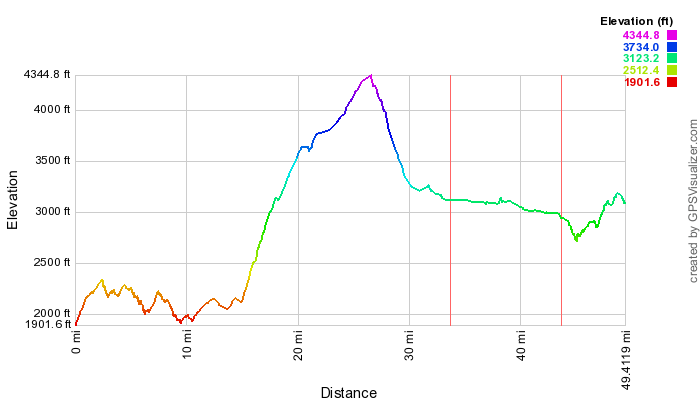
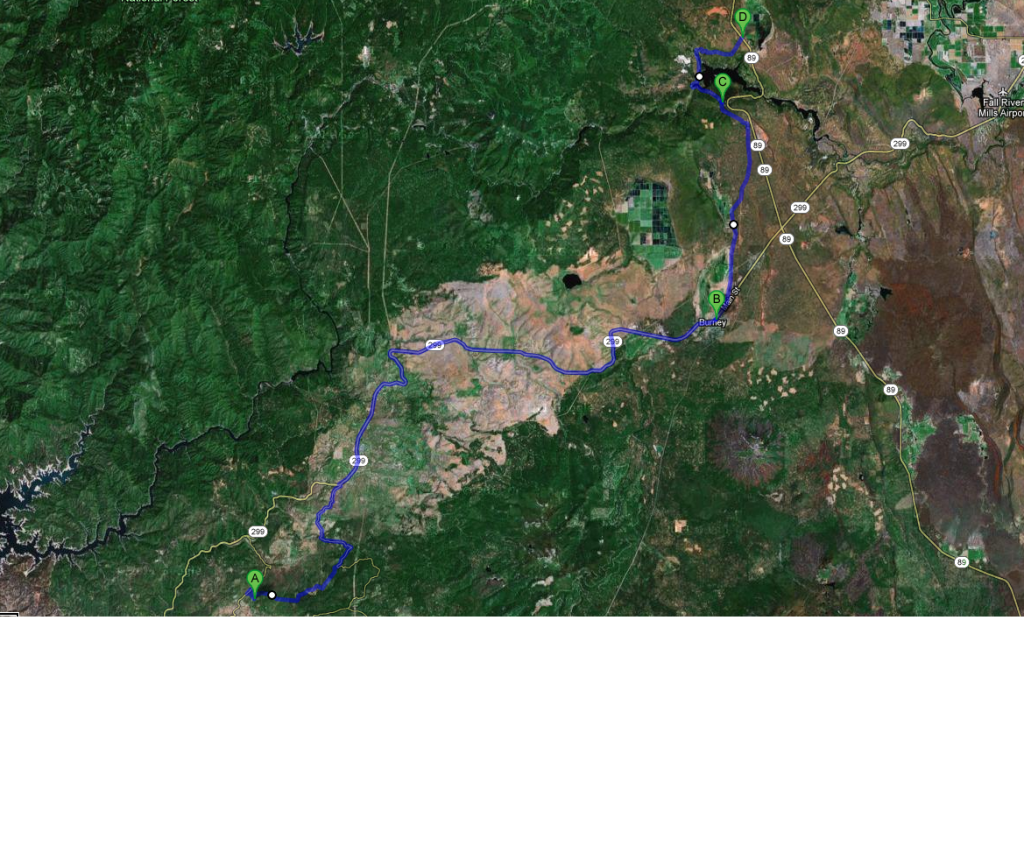
The second vertical line on the profile corresponds to destination C on the map below. This is my primary destination, Burney Falls State park.
I do not have a gid meter or other SOC indicator (not that there’s anything wrong with that) If you do have or will get one (Leafscan?) you could, of course, also analyze your kWh use and capacity by that, or other methods.
But my suggestion would be that you can simply use Carwings, for data of total kWh use between whichever initial charge % and charge end point you select. Any inaccuracies in the CW reports, IMO, are probably not nearly as significant to accuracy, as other variables, such as the “100%” charge level, the battery warnings levels, and unknown battery temperature effects, to name just a few.
About another 6,500 miles and nine months after my first range test, and after repeated tests in different conditions, I feel certain that my capacity loss is fairly small. Perhaps the largest variable remaining, is battery temperature when charging. Unfortunately, IMO, we have not gathered sufficient data to understand the larger amount of total battery capacity accepted by a warmer battery, and how much, and at what high temperature, the total charge may begin to be limited, temporarily or permanently, by the charge management system.
My earliest range test, on a hot Summer afternoon:
On 9/7/11.... When I reached my driveway, at 87 miles, I still had (less than) one bar, so I drove until I got the "very low battery" warning and simultaneously lost the last bar, at 91.5 miles. I got home with 93.4 miles, and between 5,500 and 6,000 ft. of ascent and descent, at an average speed of about 40 mph (those last 6.4 miles were up and down a hill at low speed). Since the last 1.9 miles after the "very low battery” warning were at about 20 mph and required about 150 ft. net descent with regen, I was probably still very close to the VLBW point capacity, when I parked.
According to CW, on this drive I used 18.7 kWh to drive 91.1 miles at average energy economy of 4.9 m/kWh.
I rechecked 2 other recent drives of 85-105 miles and each time CW has erred, under-reporting distance traveled, as compared with both my odometer and Google Maps, by 2.5%, +/- 0.1%....
Extrapolating from the chart, it appears CW may be saying the 1.7 kWh (8.5% from the chart, of 20.4 total kWh-anyone have a better number?) I had left at or near VLBW implies total available battery capacity of about 20.4 kWh.
http://www.mynissanleaf.com/viewtopic.php?f=31&t=5423&hilit=carwings+update&start=10" onclick="window.open(this.href);return false;
This drive was over the first 44 miles of this trip profile below, returning on the same route, with the added miles by repeating the first few miles.
On 5/31/12, I repeated the same drive, under similar hot weather conditions, covering the entire profile, with a second short loop added at the end, which totaled 47 miles by the odometer. I repeated ~miles 2-4 a half dozen times at the end till I got the VLBW, and including these miles and about 0.7 mile and about 200 ft. of altitude not on the Map, I drove 104.2 miles, to VLBW, and 105.8 miles in total, by odometer, including, I estimate, between 5,500 to 6,000 ft. of both ascent and descent..
I was not trying to replicate speed or other factors leading to my earlier m/kwh performance on this trip, just trying to find the kWh capacity between 100% charge and the same end point, about the the same short trip home (I now believe that to be about 0.2 kWh, of use, BTW) past the VLBW. I was also shooting for over 100 miles, so that I can now answer “how far..?”, with “106 miles, including a mile of up, over Hatchet MT summit, both ways”.
CW report for the 5 “trips” (# 4 is a just a start/stop cycle) is:
trip total Consum regen distance energy econ
1 8.8kWh 10.8kWh 2.0kWh 42.6miles 4.8miles/kWh
2 0.4kWh 0.7kWh 0.3kWh 3.3miles 8.6miles/kWh
3 0.6kWh 0.8kWh 0.2kWh 3.3miles 5.3miles/kWh
4 0.0kWh 0.0kWh 0.0kWh 0.0miles 0.0miles/kWh
5 7.7kWh 11.3kWh 3.6kWh 54.0miles 7.0miles/kWh
I expected higher m/kWh, as my additional miles were all low speed, and relatively level (see trips #2 and #3 above) as opposed to the ~20 miles both way of 55 mph highway over the high pass, in the middle of this trip. When I got the CW report, which is 17.5 kWh, 5.9 m/kWh, and (uncorrected) 103.2 miles, I was initially surprised by the high m/kWh, and somewhat disappointed by the low kWh capacity, which could indicate about 6% (1.2 kWh) capacity loss over this period. However, I searched my old posts, and found a partial explanation, in this low temperature report, of the same test route.
On (corrected date-9/7/11) the overnight low was in the low 60’s, and the top off was done when the ambient temp had warmed to the mid 80’s , and my best estimate that the battery was probably in the 70’s at this time. The drive was done in temperatures of 80-95 degrees. I believe (but did not record) that the battery temp indicator remained at 6 bars for the entire trip...When I made the (almost) identical drive on 11/8 of 88 miles (85.9 as reported by CW) CW reported 17.6 kWh consumed and 4.9 m/kWh. I believe my total battery capacity when I left home with a 100% charge was probably close to 19.4 kWh.
http://www.mynissanleaf.com/viewtopic.php?f=31&t=6701&start=60" onclick="window.open(this.href);return false;
I’m on PG&E E9A TOU rate now, and on 5/31/1 I charged from 80%-to 100% before 7:00 AM, at ambient temperature about 20-25F lower than I had on 9/7/11. I was still at 5 bars temp when I began the days drive on the afternoon of 5/31 at near 90 F ambient, but got a 6th bar within a few miles.
I had forgotten I had charged just before I drove, at much higher temperature, on the first test, on 9/7/11.
Oops.
My other observations have led me to believe that this cooler ambient charge temperature might be expected to reduce kWh capacity by about (?) 3%, so my total loss could be more like 3%, more or less, with the many other unknown uncertainties. I have several reports of 60-something F ambient charges, leading to 17.-something kWh capacity, but have none at a significantly higher temperature, since last summer.
I probably will try one more test, when the temp get back to the 90’s, and then wait till later in the day, to charge to 100%, and hope to get somewhere closer to the 18.7 kWh I got last year.
6/18 edit-Yesterday, 110.9 miles to VLB, 112.7 in total, by the odometer, with close to 6,000 ft of ascent and descent.
I think (and hope) my battery capacity is still so close to “new” (the initial test was after about 3,300 miles, and several Summer months) that it may be a while longer, before I can find a significant loss in capacity, by this method.
However, if you suspect you have a significant loss of capacity, say the “15%” the 12th bar loss is reported to show, I think a range/kWh test, such as this, would be very useful, as a capacity loss of that order, should show up above the other “noise” of range-affecting factors.
6/22 edit:
Revised title from previous "Range test-determine initial/reduced LEAF battery capacity"
8/1/12 edit:
Here is an updated one-way trip profile, showing the miles I have since added at the end, after it became clear my original course was not long enough.
The second vertical line on the profile corresponds to destination C on the map below. This is my primary destination, Burney Falls State park.