planet4ever said:
I've been ignoring your research on this, but finally decided it was time I paid attention. I have two questions:
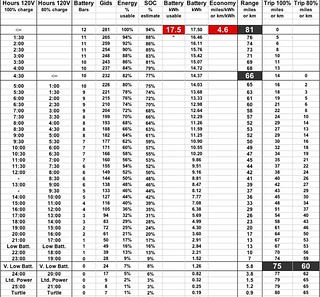
- Are the Gids shown the max, mid, or min for the time? e.g. if Gids=218, would you expect to see 1:30 or 2:00 for a 80% charge?
- Your chart clearly shows an "80%" charge as 80% of usable. Phil (Ingineer) has told us that it is really 80% of SoC. (See this post.) That would put it at about 85% of usable. Has your testing shown convincingly that he is wrong for once?
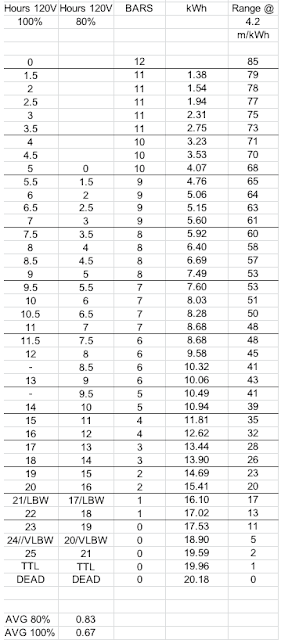
Ray, thanks for considering this approach. Although I have gathered well over 1,000 data points, I should note that the spreadsheet represents a fairly simple model as of this writing. Each hour on the 120V charging time display represents 11 Gids, and your Leaf will be dead once you have passed the 25 hour mark. Empirical data seems to fit this model reasonably well, but there was too much noise to claim more than 3-5% accuracy. The linear relationship between Gids and hours to charge was established with the help of Gary's meter. The
SOC % is just an estimate derived from the Gid count, and so is the total usable energy percentage.
You mention 80% charge. The model predicts 82% usable and 77% SOC, which is about 3% from Phil's numbers, and would be consistent with the accuracy implied in the model. For what it's worth, the empirical data I've gathered always indicated lower than anticipated range on an 80% charge. I have not been able to determine why that is, and it could be significant. In the light of this, 85% usable on an 80% charge sounds a bit too high, and I'm curious if it will hold up in your testing. That said, I would be happy to make a Gid meter available to you if needed.
The Gids listed in the chart indicate top of the hour, which means that you should see a change on the charging time display at or around the referenced Gid count.
Overall, this approach works quite well, and I have heard from several folks who have adopted it, including couple of Leaf owners in Canada. The biggest problem I see is the fact the the charging time display will lose its point of reference if you use the trickle charger. That said, you can correct for that by applying an offset. Alternatively, you can top off to 80 or 100% on 120V, and the display will reset.
For example, I have received the low battery warning at 23 instead of 21 hours once. Knowing the correct value, I could see that the offset was approximately 2 hours, and the Leaf would be dead around 27 hours instead of the anticipated 25. This additional indicator can be helpful in the lower SOC reaches, if you don't have a Gid meter, and don't want to rely solely on mile counting.

") ?
?