70 mph Range Tests: InsideEVs

My Nissan Leaf Forum

Help Support My Nissan Leaf Forum:

This site may earn a commission from merchant affiliate links, including eBay, Amazon, and others.

SageBrush

Well-known member
Joined
Mar 6, 2011
Messages
7,959
Location
NM
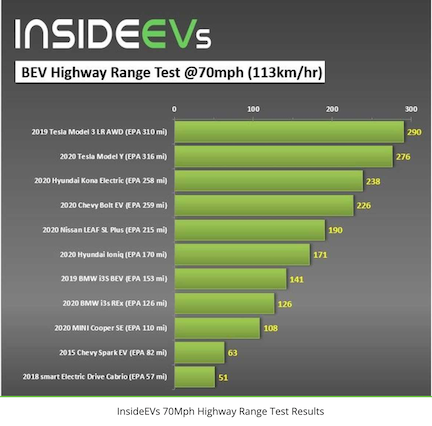
This graph gets updated as the two authors test more cars but it is pretty representative of circa summer 2020 EVs available. I like their choice of 70 mph. Keep in mind that they choose moderate weather days to drive. They often use some cabin cooling but nothing extreme and so far as I know, no cold winter driving.

They add a nice touch to the graph by adding the EPA range to the left of each car.
https://cdn.motor1.com/images/mgl/WO87r/s1/nissan-leaf-range-test.jpg

uc
 
This number should be part of the EPA or some independent live road test and included on the window sticker.
Lots of cars still need to be added to the graph.
 
smkettner said:
This number should be part of the EPA or some independent live road test and included on the window sticker.
Lots of cars still need to be added to the graph.

That and, even more importantly, a Winter range number for driving at, say, 20F with heat.
 
Not sure I agree...

It's simply more ammunition for ICE advocates to argue that EVs are not up to the task, ignoring the fact that ICE vehicles likewise go roughly 25% less far on a tank of gas, when traveling at 70 mph rather than 55 mph.

While a range chart, at various speeds and conditions, is useful information, I think that standardized range tests should be based on as few variables as possible (i.e. no wind, flat terrain, only the driver with no passengers or cargo, 55 mph average speed, 70F temp with no precip, etc). Controlling as many variables as possible, when conducting such tests, is the only fair means of comparison.

As far as winter driving is concerned, EV advocates need to point out the fact that ICE vehicles fair better in cold weather because internal combustion engines are better heaters that they are a means of generating useful work. An ICE is grossly inefficient, which often seems to be overlooked...
 
I don't think that it's fair to leave it to "EV advocates" to educate everyone considering an EV. That might work in the early adoption phase, but at this point we need for them to see it on a sticker on the car, as the dealership will either not know the info, or will lie about it. A section of the EPA sticker with, say, six clear numbers would work: city range at 70F and at 20F, highway range at 55MPH and 70MPH, both at 70F and at 20F. If they have to use just one number for range, it should be at 60MPH with the heat on at 40F. That would certainly speed the adoption of heat pumps more widely...
 
LeftieBiker said:
A section of the EPA sticker with, say, six clear numbers would work: city range at 70F and at 20F, highway range at 55MPH and 70MPH, both at 70F and at 20F. If they have to use just one number for range, it should be at 60MPH with the heat on at 40F. That would certainly speed the adoption of heat pumps more widely...

There's still a need for educating the prospective EV buyer, regardless of the EPA range number(s). Many of the same range limiting factors affect ICE cars, but because of the extensive fueling infrastructure, owners don't give them any thought - one just stops at the next gas station...

We're still very much in the early adopter phase, thanks to poor charging infrastructure and charging times. Nobody will talk about EV range anymore, once DC fast charging is ubiquitous and truly "fast" :)

Imagine if EV batteries charged in under 5 minutes and there were as many EV charging locations as there are gas stations. How big of a battery would people "need" then?
 
We're still very much in the early adopter phase, thanks to poor charging infrastructure and charging times.


We disagree on that. I'll bet that you've never plugged your scooter surreptitiously into a gas station soda cooler outlet just to make it home, or sat shivering with a blanket over you as your car charged , slowly, on L-2 in frigid weather. I'm not sure of the name for this stage, but it's intermediate, not early.
 
LeftieBiker said:
I don't think that it's fair to leave it to "EV advocates" to educate everyone considering an EV. That might work in the early adoption phase, but at this point we need for them to see it on a sticker on the car, as the dealership will either not know the info, or will lie about it. A section of the EPA sticker with, say, six clear numbers would work: city range at 70F and at 20F, highway range at 55MPH and 70MPH, both at 70F and at 20F. If they have to use just one number for range, it should be at 60MPH with the heat on at 40F. That would certainly speed the adoption of heat pumps more widely...

If that is *all* you want, just advocate for mandatory 5 cycle EPA testing and reporting.
 
alozzy said:
Not sure I agree...

It's simply more ammunition for ICE advocates to argue that EVs are not up to the task, ignoring the fact that ICE vehicles likewise go roughly 25% less far on a tank of gas, when traveling at 70 mph rather than 55 mph.
Hiding consumer information does not sound like a good idea to me for many reasons, but one of them would be consumer backlash. It would make sense though to operate the heating in an efficient way, meaning cabin heating offset with heat/wheel heating as available.
 
I am a big fan of the 70mph test and think the two are doing a great job, especially as NJ and NC have slightly different climates.

I would really like them to test the SR+ and Niro.

The graph is good too. Though unlikely, I would also like to see them test the S+ Leaf.
 
Too funny. We live in a slow part of the world. 70 mph is like 112 kmph. There is no place in this province you can legally go over 110 kmph. And no place anywhere in our valley you can go over 100 kmph. The vast majority of speed limits are 90 kmph or slower. We would absolutely slay those ranges in our model 3 in this part of the world, even with all the mountains. We did the same in our leaf. In our 4 year old 2016 SV leaf we could easily get 170 km of range. Speed is everything. LOL.

Sorry. I know it’s MUCH faster across the border (and in some other parts of Canada too).

Ok. Back to the real world. :).
 
alozzy said:

Did you draw that yourself, or is there an attribution missing...? ;)

In some cases you have to factor in time as well, not just percentage of people who buy a new technology. It just doesn't make any sense to lump people who lease a Leaf in 2020 with those who leased an EV-1 in 1996. I'm assuming that the graph above assumes that a new technology has no political or practical downsides, unlike the reality of EVs.
 
Webleafowners, the speedlimit around us (around Chicago land) is also only 90km/h (55mph). Its only when I am traveling across state(s) do I get to enjoy the faster limit, never in day to day driving.
 
DougWantsALeaf said:
Webleafowners, the speedlimit around us (around Chicago land) is also only 90km/h (55mph). Its only when I am traveling across state(s) do I get to enjoy the faster limit, never in day to day driving.

I hear ya Doug. But for us, IT’S THE WHOLE FREAKIN PROVINCE. :). Not complaint. Too many mountains and lakes and not enough people. Trans Canada highway has got some faster stretches but generally it’s sllloooowwww. :). Great for range though. :).
 
URL opens to "https://www.ou.edu/deptcomm/dodjcc/groups/99A2/curve.JPG"

Strangely enough, "https://www.ou.edu/deptcomm/dodjcc/groups/99A2" opens to a page about the DoD and anthrax vaccination.

Regardless, the graph doesn't apply to BEVs or plug-ins in general. If we go with the graph parameters, that means those buying hybrids today are "early adopters" yet they are instead "laggards" at best.

The innovator part also makes no sense. Those would be the scientists, engineers, and leadership who bring those vehicles to market, not the consumers who buy them.

If this has anything to do with vehicle new tech adoption, best explanation might be that someone learned what a standard deviation was for the first time, maybe was drinking a bit too much, had a (mis)revelation, and came up with this chart. :D
 
iPlug said:
If this has anything to do with vehicle new tech adoption, best explanation might be that someone learned what a standard deviation was for the first time, maybe was drinking a bit too much, had a (mis)revelation, and came up with this chart. :D
:lol:
You are obviously right; I would not take the graph too seriously, and even less so the labels.
The one thing these graphs of historical adoption tend to show (and not a bell curve) is that new tech adoption is +/- sigmoidal, in fact rather like a virus epidemic. The curve upward appears linear and flat-ish in the beginning (although it is not) and then 'takes off.'
 
Back
Top