matth
Well-known member
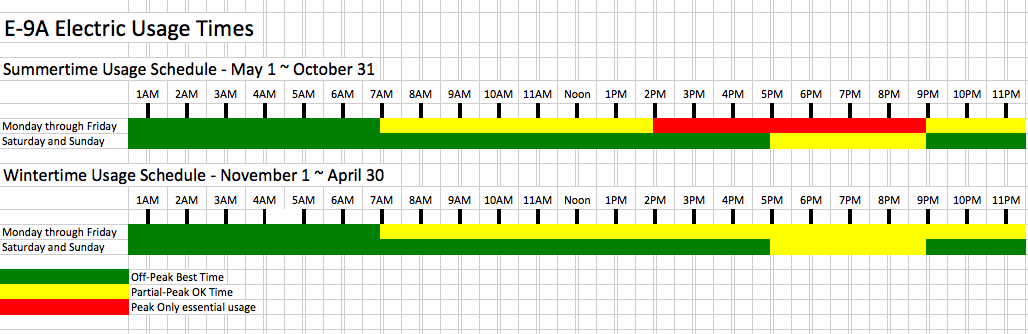
My household wanted a graphic way to figure out when peak/part peak/off peak hours are, so I made this. It's a bit crude, but it might useful for others as well.
It includes times and a $ multiplier based on the off peak rate, and tier 1, which is where I mostly live.
EDIT: I discovered an error I'd made in weekday evening rates. Fixed now, with better colors.
https://docs.google.com/open?id=0B7axCSCb8HEJNFFKeXZQQVNwa3M" onclick="window.open(this.href);return false;