What SOC% does each bar on Leaf dash represent ?

My Nissan Leaf Forum

Help Support My Nissan Leaf Forum:

This site may earn a commission from merchant affiliate links, including eBay, Amazon, and others.
Wow!
Nissan "hides" Capacity loss until 15% is lost (85% remains), and only then do they drop theb12th Capacity-Bar, making you think that you only lost 1/12th (8.3%) but you have actually lost almost TWICE that amount (15%)?
 
garygid said:
Wow!
Nissan "hides" Capacity loss until 15% is lost (85% remains), and only then do they drop theb12th Capacity-Bar, making you think that you only lost 1/12th (8.3%) but you have actually lost almost TWICE that amount (15%)?

Which means if you are buyinga second hand LEAF you'll need an SOC meter to see what it registers when full.
 
LakeLeaf said:
OK - trying to understand some of the inner workings a bit more.

So have you been able to figure out - when the car takes a particular action - e.g. going into turtle mode - does it do it based on the actual SOC number, or based on the projected range number?

The later would seem to explain some of the outlier reports we've read, but it also seems to be a strange way to take action.

I suspect the turtle mode decision is based on individual cell voltages.

During discharge, Li-Ion batteries have a very constant voltage from 80%-20% SOC (WAG: Wild A$$ Guess). Cells do not have the exact same capacities, so some will hit the 20% mark sooner than others. Below 20%, the cell voltages start dropping.

As the battery continues to discharge, some cells are likely to hit the minimum cell discharge voltage (Vmin) (depending on discharge current). I expect that when Vmin occurs, turtle mode is engaged to limit power draw, and reduces Pmax (maximum allowed power) each time Vmin is reached. At some point, Pmax=0, as the most discharged cell is constantly at Vmin, even with P=0 (actually reaching this point is very hard on the battery - you really don't want to go here.)

As a newcomer, I don't yet know what data is avalible. Does anyone have the ability to read out individual cell voltages?

Brett, Gilbert, AZ (near Phoenix)
2012 Leaf; ordered May; delivered Dec21, 2011; <300 Miles
 
surfingslovak said:
....

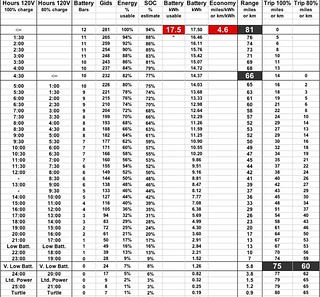
What exactly is the model then? It's essentially an approximate SOC point to kWh mapping. The mapping itself is speculative, but it seems to be be in alignment with other observations voiced on this forum and with the data gleaned from the few and far between comments from Nissan. I also found some very helpful information on the Tesla owners forum, and I believe that the Leaf is much closer to the Roadster in terms of charging protocols and battery care than we think or Nissan has admitted.

But back to the model. SOC 281 is not valued at 100%, because it very likely does not represent 100% pack capacity. It's the full available charge, which is less than 24kWh for the sake of battery longevity. The mapping I'm proposing assumes 320 SOC points representing 24kWh. Each point would be 0.075kWh or 75Wh. There is a silent reserve on both ends. It's likely 20 points below zero, that's what's left in the pack when the Leaf stops dead after turtle. There are another 19 points above 281 to make it full 320 SOC points. I took this metric and added pack SOC % and kWh estimates to your chart.

....

My comments are based on my knowledge of laptop battery performance/operation, and my background as an electrical engineer working with microcontrollers, sometimes within laptops. (Consider researching how laptop battery controllers estimate remaining charge, i.e. "gas gauge" functions.)

The 0-(320) SOC Points suggest to me a working measure of the energy remaining in the battery pack based only on Coulomb counting (or integrating battery current over time).

There are factors that affect battery capacity that have nothing to do with battery current.
Battery temperature: 1) discharge efficiency, 2) self discharge rate, and 3) actual capacity.
Discharge current: 4) discharge efficiency (faster discharges are more expensive in terms of actual capacity).
Time since last charge: 5) actual capacity (due to self discharge).
Age of battery: 6) discharge efficiency, and 7) actual capacity (age reduces capacity - even batteries sitting on the shelf doing nothing).
Cell equalization: 8) each cell in the battery pack will respond differently to each of these effects.
Battery use history: 9) number and depth of discharge/recharge cycles.

At best, a BMS can only estimate the affect of each of these factors, and assign what the current 100% SOC is in terms of SOC Points.
Because this is only an estimate, the actual (and current) 100% SOC needs to be reset (recalibrated) by periodically performing an equalization charge to fully charge all battery cells to 100%. As soon as all cells are charged to 100%, the BMS resets the SOC to 100% and SOC Points to (320?). After that the 100% SOC Point only reduces until the next equalization.

Each of these effects only reduce the SOC Point that is considered 100% SOC. Performing an equalization charge tends to restore the 100% SOC Point, but does not exceed the previous 100% SOC point (hence battery aging and capacity reduction).

Assuming the operator regularly charges to 80%, the 100% SOC Point would slowly decrease over time and discharge cycles. Performing a 100% charge would tend to restore the 100% SOC Point back to its previous level. Has anyone captured data that looks like it might be an SOC Point that slowly decreases with each discharge cycle between 100% charges?

Dividing the current SOC Point by the 100% SOC Point should give a very good idea what the BMS thinks is the remaining %SOC.
 
GregH said:
TonyWilliams said:
Your car shouldn't get the same SOC number all the time. Do you ALWAYS get 272 on a full charge?
Ha! No! You're absolutely right.. I even started a separate thread... I want my 281! Lately the lowest I've seen is 271# and the highest 274#. The all time highest I've seen on my car was 280# but that was a while ago... The car is nearing 2000 miles and 3 months and rarely spends much time over 80% (or 225#) or under 20% (or ~50#)

Try a 100% charge cycle....
 
As the LEAF's Battery Pack loses Capacity over time, at perhaps 16% loss only 11 of the 12 small Capacity-Bars will be lit.

However, when you "fill" the Pack (a 100% charge) apparently the LEAF will still display 12 fuel-Bars, as if to say that your SMALLER fuel tank is FULL.

However, then each fuel-Bar will represent LESS energy than it did when the Pack was new. Personally, I think that this choice, if it is indeed what the LEAF does, is a very misleading choice!!!

From this, we assume the "gid" value will still read about 281 when 100% full. We have not found the "capacity" value in the CAN data, but we see the "Fuel-Bars" (0-12) count, and a related 12-value that is likely to be the Capacity-Bars.
 
garygid said:
As the LEAF's Battery Pack loses Capacity over time, at perhaps 16% loss only 11 of the 12 small Capacity-Bars will be lit.

However, when you "fill" the Pack (a 100% charge) apparently the LEAF will still display 12 fuel-Bars, as if to say that your SMALLER fuel tank is FULL.

However, then each fuel-Bar will represent LESS energy than it did when the Pack was new. Personally, I think that this choice, if it is indeed what the LEAF does, is a very misleading choice!!!

From this, we assume the "gid" value will still read about 281 when 100% full. We have not found the "capacity" value in the CAN data, but we see the "Fuel-Bars" (0-12) count, and a related 12-value that is likely to be the Capacity-Bars.
(other) Gary, that's one for the 'most obscure Leaf facts - way out there' thread.
:p
 
EVDRIVER said:
An 8% variance could be eight miles or more depending, not exactly a useful scale. If one was not watching and the bar just shifted one would not know if the bar were about to go down any minute or had just gone down making the estimation even more difficult.

I have a rule of thumb I use to determine where in a bar I am, and have been quite successful in predicting a bar going out within a few hundred yards!!

Here's what I do. I look to see how many bars to return the vehicle to a charged state, be that 80% or 100%. For me that's always 80%.

Then I do a quick mental calculation, each bar takes approx 1 1/2 hours to replenish at 120v, the gauge indicates time to recharge at both 240v and 120v. So if 4 bars are extinguished, that would translate to 6 hours at 120v. When the estimate reaches 6 1/2 hours I know that I have consumed some of the next bar and that it will extinguish fairly soon.

So the basic formula is # bars X 1.5 hours + 30 minutes. Once this point is reached for the 120v recharge estimate the bar will go out in about 1/2 mile.

The first bar seems to be a special case, it will extinguish shortly after the estimate reaches 50 minutes to recharge at 120v.

This rule of thumb applies to driving only, if the car is switched off and back on a bar will extinguish ahead of the rule of thumb. I have noticed that sometimes the first bar will extinguish before any time estimates are displayed, probably a bug in the algorithm.

Thank You for making range estimating so difficult Nissan.
 
JPWhite said:
Then I do a quick mental calculation, each bar takes approx 1 1/2 hours to replenish at 120v, the gauge indicates time to recharge at both 240v and 120v. So if 4 bars are extinguished, that would translate to 6 hours at 120v. When the estimate reaches 6 1/2 hours I know that I have consumed some of the next bar and that it will extinguish fairly soon.

So the basic formula is # bars X 1.5 hours + 30 minutes. Once this point is reached for the 120v recharge estimate the bar will go out in about 1/2 mile.

The first bar seems to be a special case, it will extinguish shortly after the estimate reaches 50 minutes to recharge at 120v.
Thanks! That's a useful tip! I will assume this applies only to "like new" batteries.

So, to put this in table form, one would expect to lose the following bars just after seeing these 120V charge estimates:

Bar | Charge Estimate
------------------------
12 | 0:50
11 | 2:00
10 | 3:30
09 | 5:00
08 | 6:30
07 | 8:00
06 | 9:30
05 | 11:00
04 | 12:30
03 | 14:00
02 | 15:30
01 | 17:00
 
RegGuheert said:
That's a useful tip! I will assume this applies only to "like new" batteries.

I assume so as well. I 'estimate' I've lost between 5-10% of original capacity based on a perceived drop in range when fully charged. I don't have a GID meter so I could be way off.
 
Is there any way to display time to 100% charge on the dash if the charge timers are set to 80%?

Otherwise, what would your rules look like for time to charge to 80%? Should I simply subtract 3:30 from all of the numbers since that is what I read on Carwings after a charge to 80%?
 
RegGuheert said:
Is there any way to display time to 100% charge on the dash if the charge timers are set to 80%?

Otherwise, what would your rules look like for time to charge to 80%? Should I simply subtract 3:30 from all of the numbers since that is what I read on Carwings after a charge to 80%?
That is probably the best method - charge to 80% and see what Carwings estimates to 100%. FWIW - my car estimates 4:00 to 100% on L1 when charged to 80% in CARWINGs (have all firmware updates). But I think new cars estimate 4:30 to 100% on L1 based on surfingslovak's reverse range chart:
surfingslovak said:
 
This is a pretty old thread... but I was wondering if anyone has made a decal to go over the dash display lining the SOC % with the bars?
Could be handy.
 
TOPleaf said:
This is a pretty old thread... but I was wondering if anyone has made a decal to go over the dash display lining the SOC % with the bars?
Could be handy.

I had thought about that, but a Gidmeter makes the entire fuel gauge redundant.
 
Has anyone noticed that the first 2% SOC seem to be used (100,99) faster then the lower % SOC? I can usually only get a few tenths of a mile on the 100% reading, and maybe a mile on 99%. Below that it goes to a normal "range" where if driving conservatively, I can get 1.3-1.5 miles per percent SOC (20-35 mph with slow acceleration).
 
The 11 and 12s are the same way...

DougWantsALeaf said:
Has anyone noticed that the first 2% SOC seem to be used (100,99) faster then the lower % SOC? I can usually only get a few tenths of a mile on the 100% reading, and maybe a mile on 99%. Below that it goes to a normal "range" where if driving conservatively, I can get 1.3-1.5 miles per percent SOC (20-35 mph with slow acceleration).
 
Either the 2015 breaks the mold or I got something funky going on.

I charged to 100% and drove to work this morning, about 17 miles and the SOC% on the dash says 85%. But dash is still showing 11 bars :? . Carwings also reports 11 bars. With the 2012, the first bar always seemed like the "thinnest" bar.

Is this normal for 2015?

Edit: So finally driving at lunch it dropped to 10 bars at an indicated 83% SOC (243 GIDs per LeafStat). Not as funky as I'd thought since I was right on the cusp of dropping to 10 bars. But still, bars 12+11 came to be about 13% previously, and 17% is a bit higher than I expected.
 
Back
Top