Better (reverse) SOC meter already in the car?

My Nissan Leaf Forum

Help Support My Nissan Leaf Forum:

This site may earn a commission from merchant affiliate links, including eBay, Amazon, and others.
TonyWilliams said:
How about just 4.42 * (120vHours) - 100 = -SOC%
Great idea, I really like it! For my Leaf, this formula appears to be even simpler:
Code:
SOC % = 100 - 4 * T(120V)
 
abasile said:
fooljoe said:
11 hours for 80% on 240v? Tony, I think your car's broken.
The time to charge auto-adjusts depending on the available supply last time you plugged in. Using my Rev. 1 modified EVSE which supplies only 12A at 240V, the reported time to charge at 240V is significantly longer. Even with "standard" L2 charging, there is likely to be some variation.
Even with a Rev 1 upgrade the time should be no more than half the 120v time. And even with a Rev 1 upgrade plugged into 208v it should be no more than 9.5 hours with a 16 hour 120v time.

Thanks for the data and math everybody! Looks like we could have a fairly useful tool here.
 
Yes. The reading at Hour 7 and 8 was the same on the return trip. The snafu at 150Gids was due to my expectation that the Time to Charge would keep changing at 1/2 hour increments. I should be able to compare these numbers on trip tonight.
lukati said:
91040 said:
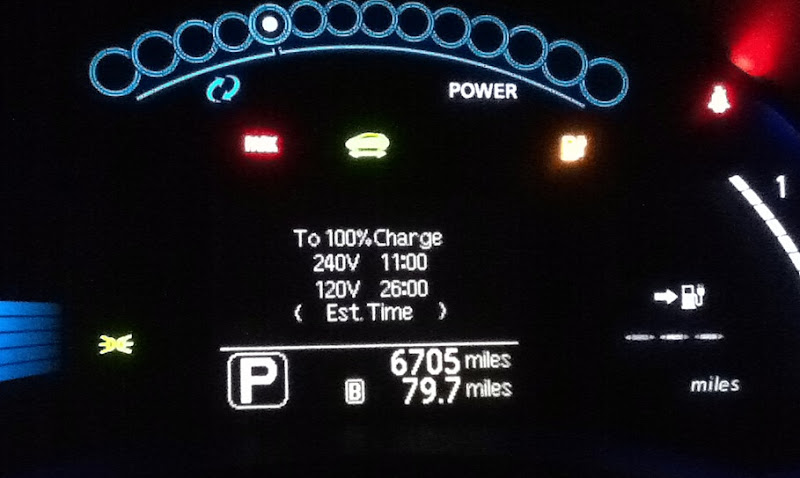
From my trip today. Time to 100% Charge on 120V in relation to Gids:

2 hours- 253 Gids
2.5 hours- 248
3 hours- 240
3.5 hours- 234
4 hours- 228
4.5 hours- 221. Return trip- 224
5 hours- 216. Return trip- 219
5.5 hours- 210. Return trip- 211
6 hours- 203. Return trip-205
6.5 hours- 197. Return trip- 198
7 hours- 191
7.5 hours- 186. Return trip-185
8 hours- 179
8.5 hours- 172. Return trip- 175
9 hours- 168. Return trip- 169
9.5 hours- 160. Return trip- 161
10 hours- 155
Not sure if this was at 10.5, 11 or 11.5 hours- 150
Next was definitely:
12 hours- 140
13 hours- 122
14 hours- 109
15 hours- 99
16 hours- 87
17 hours- 79
18 hours- 65

Those data are beautifully linear. In fact R = -0.997!

You get Gids using the following formula:

Gids = hours (to 100% charge at 120V) x -11.65 + 273.2

The linear fit thus estimates maximum Gids to be 273 and charge time from empty to be 23.4 hours.

P.S. I took all data points, except 10.5-11.5. I also assumed that on the return trip the 7 and 8 hour data points were identical to those during the first trip.
 
91040 said:
Yes. The reading at Hour 7 and 8 was the same on the return trip. The snafu at 150Gids was due to my expectation that the Time to Charge would keep changing at 1/2 hour increments. I should be able to compare these numbers on trip tonight.
Thanks for the confirmation. You took that snafu reading at 10.5 hours by the way. The data make that very clear. :)
 
lukati said:
91040 said:
Yes. The reading at Hour 7 and 8 was the same on the return trip. The snafu at 150Gids was due to my expectation that the Time to Charge would keep changing at 1/2 hour increments. I should be able to compare these numbers on trip tonight.
Thanks for the confirmation. You took that snafu reading at 10.5 hours by the way. The data make that very clear. :)
That is what I thought as well. Probably got confused by it being late, being tired and listening to the radio.
 
arnolddeleon said:
At end BayLEAFs gathering today someone shared a potentially awesome tip on a better (reverse) SOC meter that is already built-in to the car and can get read from the dash.

The idea is simply use the 110V time to 100% charge display. It is definitely a big improvement over the bars in that you get 1/2 hour steps it there are that are at least 22 steps (he said there are 24). It it turns to be 24 steps that means 4% steps, that would a huge improvement over the bars. I would be quite happy to get 2% steps (of course more steps would be better but the precision in the SOC may not be there anyway).

I have not heard about this tip in any of the discussion on the SOC meter (any my attempts to search for it didn't turn up any matches). I didn't get the person's name to give him proper credit.

arnold

Hi Arnold,

It was nice talking with you Saturday, I was the one that brought it up with you. we can start collecting more data on this, especially correlating the charge time with Gary's SoC gauge (GID).

Below is what I noticed (I've always set display to show charge timer by default since I started driving the car). Keep in mind I'm referring to the 110V timer:
- at the high end (full charge), the charge timer is not very accurate. I can drive 10 miles before the timer stop showing --:--
- at the high end, the charge timer has higher granularity (goes up in 20min increments)
- from 1 hour to about 7hours, the timer counts in 30min increments (should be down to 8 bars by then)
- after that, the time counts in 1 hour increments until the SoC bar goes to zero. I've gotten the timer to go as high as 22:00, but I'm too chicken to actually get to turtle so I don't know high high it displays.
- except at the high end (near full charge), I've found the charge timer to be fairly well correlated to to our 12-bar SoC gauge.
- I find the timer very useful at the low end (near full discharge), as it maps about 2~3 hour per SoC bar, so gives me a peace of mind.

cheers,

Jack
 
yoyofella said:
- except at the high end (near full charge), I've found the charge timer to be fairly well correlated to to our 12-bar SoC gauge.

I think it makes perfect sense that they are correlated. The SOC gauge displays the internal measurement of the SOC (using some filter or smoothing algorithm). The charge timer also needs to know the current SOC, so unless the LEAF has two independent measurements, the raw data to calculate charging time must come from the same internal information.
 
yoyofella said:
- at the high end (full charge), the charge timer is not very accurate. I can drive 10 miles before the timer stop showing --:--
- after that, the time counts in 1 hour increments until the SoC bar goes to zero. I've gotten the timer to go as high as 22:00, but I'm too chicken to actually get to turtle so I don't know high high it displays.
- I find the timer very useful at the low end (near full discharge), as it maps about 2~3 hour per SoC bar, so gives me a peace of mind.
Jack, good on you to bring this up at the meeting. I wish I was there to join in on the discussion, but I had to leave early.

In addition to 91040's test run, which is greatly appreciated, I took my Leaf from full to turtle the other day and confirmed that the rock bottom of the 120V charging time gauge (T120) is 25 hours. My Leaf is on firmware version 3NA0B. Lukati graciously confirmed that the charging time indicator correlates linearly to gids. I wanted to check if T120 could be applied to Tony's range chart. It may take me a day or two, but I hope to get to it soon.

I did some number crunching, and estimated that one hour on T120 should average about 840 Wh or 4% SOC. This means that a 2-hour increment on the T120 gauge should equal to one battery bar. I used this rough approximation last month, and it worked well. If I remember correctly, the few data samples I looked at earlier this year indicated that a gid was on average about 72 Wh. Using the ratio of 11.65 per hour lukati computed from 91040's data sample, we get 839 Wh per hour on T120. Using averages from the same dataset, we get 11.74 * 72 = 845 Wh.

While the results are very promising, it would be good to collect a larger data sample. It would be especially helpful to validate this approach with Nissan's latest firmware.


According to the dash, my Leaf expended nearly exactly 21 kWh to travel 107.1 miles:

21,000 Wh / 25 = 840 Wh (T120)
 
More data.

Time to 100% Charge on 120V in relation to Gids:

Trip 1/ Return- 12/4/11. Trip 2- 12/5/11

1.5 hours - - - - - - - - - - 259 Gids
2 hours- 253 Gids - - - - 253
2.5 hours- 248 - - - - - - -249
3 hours- 240 - - - - - - -241
3.5 hours- 234 - - - - - - -233
4 hours- 228 - - - - - - -228
4.5 hours- 221 / 224 - - - 223
5 hours- 216 / 219 - - - 216
5.5 hours- 210 / 211 - - - 211
6 hours- 203 / 205 - - - 203
6.5 hours- 197 / 198 - - - 198
7 hours- 191 / same - - 191 (end of 1st leg of trip)
7.5 hours- 186 / 185 - - - 187
8 hours- 179 / same - - 182
8.5 hours- 172 / 175 - - -176
9 hours- 168 / 169 - - -169
9.5 hours- 160 / 161 - - -163
10 hours- 155 - - - - - - 155
11 hours- 150 - - - - - - 150
12 hours- 140 - - - - - - 139
13 hours- 122 - - - - - - 127
14 hours- 109 - - - - - - 111
15 hours- 99 - - - - - - - 101
16 hours- 87 - - - - - - - -88
17 hours- 79 - - - - - - - -78
18 hours- 65 - - - - - - - -69
19 hours- - - - - - - - - - - 49 (LBW just after)
20 hours- - - - - - - - - - - 33
21 hours- - - - - - - - - - - 23 (VLB same time)
No change- - - - - - - - - - - 7 Turtle
No change- - - - - - - - - - - 6 End

The drop seems inconsistent between 10 and 11 hours which is what confused me the first trip.
 
91040 said:
More data.

Time to 100% Charge on 120V in relation to Gids:

Trip 1/ Return- 12/4/11. Trip 2- 12/5/11

1.5 hours - - - - - - - - - - 259 Gids
2 hours- 253 Gids - - - - 253
2.5 hours- 248 - - - - - - -249
3 hours- 240 - - - - - - -241
3.5 hours- 234 - - - - - - -233
4 hours- 228 - - - - - - -228
4.5 hours- 221 / 224 - - - 223
5 hours- 216 / 219 - - - 216
5.5 hours- 210 / 211 - - - 211
6 hours- 203 / 205 - - - 203
6.5 hours- 197 / 198 - - - 198
7 hours- 191 / same - - 191 (end of 1st leg of trip)
7.5 hours- 186 / 185 - - - 187
8 hours- 179 / same - - 182
8.5 hours- 172 / 175 - - -176
9 hours- 168 / 169 - - -169
9.5 hours- 160 / 161 - - -163
10 hours- 155 - - - - - - 155
11 hours- 150 - - - - - - 150
12 hours- 140 - - - - - - 139
13 hours- 122 - - - - - - 127
14 hours- 109 - - - - - - 111
15 hours- 99 - - - - - - - 101
16 hours- 87 - - - - - - - -88
17 hours- 79 - - - - - - - -78
18 hours- 65 - - - - - - - -69
19 hours- - - - - - - - - - - 49 (LBW just after)
20 hours- - - - - - - - - - - 33
21 hours- - - - - - - - - - - 23 (VLB same time)
No change- - - - - - - - - - - 7 Turtle
No change- - - - - - - - - - - 6 End

The drop seems inconsistent between 10 and 11 hours which is what confused me the first trip.

Great! We now have n=64. The data are virtually superimposable and the analysis gives essentially the same result as yesterday.

A free linear fit gives a slope of -11.75 [Gids/hour] and an intercept of 274.6 [Gids] with R = -0.998

A linear fit forced through data point (0/281) gives a slope of -12.29 [Gids/hour] and an intercept of 281 [Gids].

From this follows: SOC% = -4.37 x hours (to 100% at 120V) + 100. Essentially the same value as yesterday (-4.42).

I used all data except the last two data points without charging time. Nothing happens around 10-11 hours. The data are linear all the way down.

These values will not change significantly with more 91040 data. What we need is another volunteer to see if the ~4.4%/hour value holds true for other cars.

I will be using this SOC meter on my trip home from the dealer tomorrow. My first electric trip in the Chicago cold will be about 65 miles. Wish me luck!
 
91040 said:
More data.

Time to 100% Charge on 120V in relation to Gids:

Trip 1/ Return- 12/4/11. Trip 2- 12/5/11

1.5 hours - - - - - - - - - - 259 Gids
2 hours- 253 Gids - - - - 253
2.5 hours- 248 - - - - - - -249
3 hours- 240 - - - - - - -241
3.5 hours- 234 - - - - - - -233
4 hours- 228 - - - - - - -228
4.5 hours- 221 / 224 - - - 223
5 hours- 216 / 219 - - - 216
5.5 hours- 210 / 211 - - - 211
6 hours- 203 / 205 - - - 203
6.5 hours- 197 / 198 - - - 198
7 hours- 191 / same - - 191 (end of 1st leg of trip)
7.5 hours- 186 / 185 - - - 187
8 hours- 179 / same - - 182
8.5 hours- 172 / 175 - - -176
9 hours- 168 / 169 - - -169
9.5 hours- 160 / 161 - - -163
10 hours- 155 - - - - - - 155
11 hours- 150 - - - - - - 150
12 hours- 140 - - - - - - 139
13 hours- 122 - - - - - - 127
14 hours- 109 - - - - - - 111
15 hours- 99 - - - - - - - 101
16 hours- 87 - - - - - - - -88
17 hours- 79 - - - - - - - -78
18 hours- 65 - - - - - - - -69
19 hours- - - - - - - - - - - 49 (LBW just after)
20 hours- - - - - - - - - - - 33
21 hours- - - - - - - - - - - 23 (VLB same time)
No change- - - - - - - - - - - 7 Turtle
No change- - - - - - - - - - - 6 End

The drop seems inconsistent between 10 and 11 hours which is what confused me the first trip.

Good work 91040 on mapping the data. I have a question on the charge timer: in your data set there's no more increment after 21hr, but in Slovak's test he was able to run it down to 25hr charge time. Any explanation for the inconsistency? I'm very curious about the reading on the low range.

Also, what's the correlation between gid and the on-board SoC bars?

again, thanks for sharing the data.
 
lukati said:
hat we need is another volunteer to see if the ~4.4 Gids/hour value holds true for other cars.
You meant 4.4% per hour, right? The gid value is around 11 or 12. Nice collaboration otherwise, this is really fun. Good luck with your new Leaf tomorrow! I received slightly diverging data the other night. I wish I had Gary's SOC meter, but perhaps I can borrow one locally for a test drive.

I drove 79.7 miles on a charge with average trip economy of 3.9 mpk, which translates to 20.43 kWh expended. I was exactly 2 miles into the VLBW, and turtle was likely just around the corner. I did not want to stress the pack any further, especially since the ambient temperature dropped close to freezing. Here is how the dashboard looked like at the end of the trip:


Click to enlarge

The average capacity per one T120 hour for this trip is: 20,430 / 26 = 785 Wh. Quite different from the day before. Additionally, I received the LBW at the 23-hour mark and the VLBW at the 26-hour mark.

So far, I have seen turtle mode kick in at 22 hours, 24 and 25 hours. It would likely have kicked in at 26 hours yesterday, if I kept driving. We need more data, obviously, but it's becoming clear that turtle mode cannot be correlated to an absolute value on the T120 gauge. The charging time display readout will have to be interpreted in relation to other data available on the dashboard.
 
surfingslovak said:
So far, I have seen turtle mode kick in at 22 hours, 24 and 25 hours. It would likely have kicked in at 26 hours yesterday, if I kept driving. We need more data, obviously, but it's becoming clear that turtle mode cannot be correlated to an absolute value on the T120 gauge. The charging time display readout will have to be interpreted in relation to other data available on the dashboard.
You guys are getting into turtle too often !

Yes - looks like # of hours doesn't correspond well to turtle. I think the more we dig, the more clear it gets why Nissan didn't want to give a numerical SOC meter.
 
surfingslovak said:
I drove 79.7 miles on a charge with average trip economy of 3.9 mpk, which translates to 20.43 kWh expended. I was exactly 2 miles into the VLBW, and turtle was likely just around the corner. I did not want to stress the pack any further, especially since the ambient temperature dropped close to freezing.

Were the "available power rings" (I don't know what else to call them) starting to retract? In other words, did you have one or two more miles available, or was turtle imminent? Edit: I see that you had all the power rings from the picture.

What do you think the battery temp was? You have 5 temp bars, so between 50F-74F-ish battery temp. Was it significantly warmer earlier, and the battery never had a chance to cool down?

The bottom line, you're very close to the 21kWh usable for a 70F battery.
 
evnow said:
I think the more we dig, the more clear it gets why Nissan didn't want to give a numerical SOC meter.

But, their smoothed post OCV data (our Gids) are pretty darn good for an SOC meter. Pretty darn consistent with the Battery Warnings, and Turtle.
 
lukati said:
I will be using this SOC meter on my trip home from the dealer tomorrow. My first electric trip in the Chicago cold will be about 65 miles. Wish me luck!

Good luck. I think that you are well prepared for your trip. Preheat while plugged in before leaving the dealer !!!!
 
TonyWilliams said:
Were the "available power rings" (I don't know what else to call them) starting to retract? In other words, did you have one or two more miles available, or was turtle imminent? What do you think the battery temp was? You have 5 temp bars, so between 50F-74F-ish battery temp. Was it significantly warmer earlier, and the battery never had a chance to cool down? The bottom line, you're very close to the 21kWh usable for a 70F battery.
Tony, you raise very good points. I found a dashboard picture from the trip, and it shows that the power rings did not start to retract. The temperature gauge had five bars, which means that its large thermal mass kept the pack warm. The Leaf is usually parked in a covered garage structure with about 55 F ambient temperature and the car wasn't exposed to the elements for more than four hours.


Click to enlarge
 
Back
Top