Range Chart

My Nissan Leaf Forum

Help Support My Nissan Leaf Forum:

This site may earn a commission from merchant affiliate links, including eBay, Amazon, and others.
planet4ever said:
Now that is what I call weird math.......
It's a good thing you fudged it, because here is the correct calculation:
Code:
10 / 4.5 =  2.22 kWh
70 / 3.9 = 17.95 kWh
10 / 3.0 =  3.33 kWh
           -----
           23.50 kWh

an 8% error in a possibly disastrous direction.


Thanks for pointing out my error(s). I'll correct the original post.

Not sure why you think it's good that I "fudged" it.

:?

Tony
 
Been trying to follow this, but if I could ask a quick analysis on my journey yesterday.

72.5 miles, mixed stop-and-go traffic, and freeway (not much over 70 though). probably 2-dozen red traffic lights. Some a/c.

When I got home I had a low-battery warning and 1 bar showing (though when i restarted it there were zero bars).
So that's 6miles/bar

Guess-o-meter said "3-miles" remaining

Average economy was 4.0 m/kWh.
72.5/4.0 = 18.13 kW

I've seen various estimates of "useful capacity" but if I use 21.5kWh that's suggesting I had another 13.5miles remaining (at the same 4.0 economy)

Does that sound reasonable? Actually 13.5 miles remaining despite the display showing only 3?
This would be consistent with the suggestion that there are really 14 bars, but we can only see 12.

Unfortunately the final 20 miles of my journey is potentially the fastest. I say "potentially" as, with 15 miles remaining and a display reading 19, I held back from what I'd prefer to be driving. Overly cautious?


To charge it took 22.18kW
18.13/22.18 = 81.7%

Thanks,
Shaun
 
It's pretty well accepted that the "new" VCM software moved two bars to below the displayed 12 so, yes, there are effectively two hidden bars.

gbshaun said:
I've seen various estimates of "useful capacity" but if I use 21.5kWh that's suggesting I had another 13.5miles remaining (at the same 4.0 economy)
 
gbshaun said:
I've seen various estimates of "useful capacity" but if I use 21.5kWh that's suggesting I had another 13.5miles remaining (at the same 4.0 economy)
Very nice data set, thank you for sharing. Please note that the recommended multiplier is 21kWh and the actual value might be lower, around 20.3kWh. This correlates with the data other owners have posted recently. I'm saying multiplier, because Nissan does not want to disclose what the available pack capacity is and this number is just an approximation we use in our model.

gbshaun said:
This would be consistent with the suggestion that there are really 14 bars, but we can only see 12.
Yes, that's my understanding as well and this approximation worked well for me in real-world driving.

gbshaun said:
Unfortunately the final 20 miles of my journey is potentially the fastest. I say "potentially" as, with 15 miles remaining and a display reading 19, I held back from what I'd prefer to be driving. Overly cautious?
No, I would do the same. As garygid and other knowlegeable posters noted, we cannot rely on the reserve capacity to be always there. It depends on a number of factors, and it's good to err on the side of caution.

gbshaun said:
To charge it took 22.18kW
18.13/22.18 = 81.7%
This appears to be on the low side. I've been using 85% charger efficiency lately, which was a good match for most of the data sets. Was it trickle or standard charge?
 
surfingslovak said:
gbshaun said:
To charge it took 22.18kWh
18.13/22.18 = 81.7%
This appears to be on the low side. I've been using 85% charger efficiency lately, which was a good match for most of the data sets. Was it trickle or standard charge?

Thanks for all the comments.

This morning the average economy display showed 3.9 (down from 4.0 last night before i turned it off.)
Effect:
72.5/3.9 = 18.59kWh
18.59/22.18 = 84% charging efficiency (Blink 220v home unit)
 
gbshaun said:
surfingslovak said:
gbshaun said:
Effect:
72.5/3.9 = 18.59kWh
18.59/22.18 = 84% charging efficiency (Blink 220v home unit)


Absolutely "textbook" !

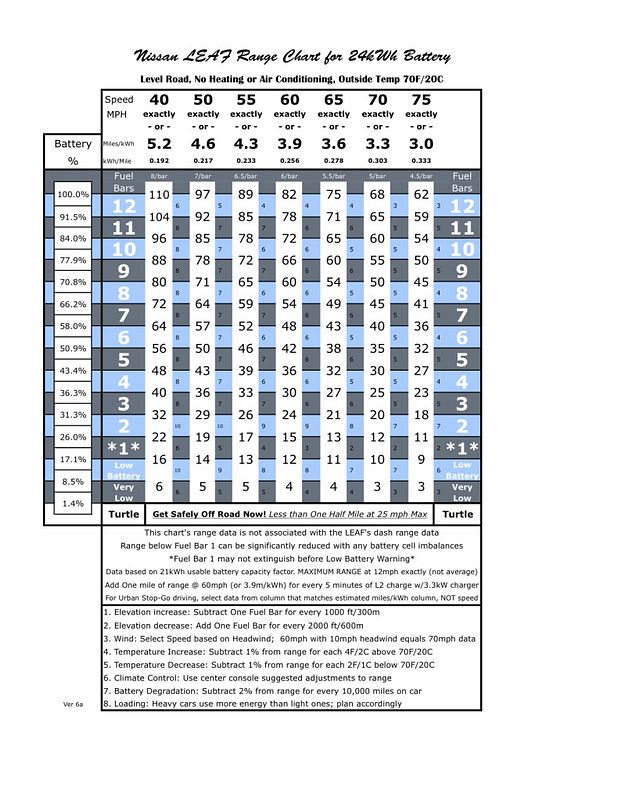
3.9 kWh is good for about 81 miles, so I think you had about a bit less than 10 miles left. If you needed 12 miles, you needed to slow down. All the stipulations apply.

When you get Low Battery Warning, I would forget about how many fuel bars there are. It's fine as a guideline; for example, 6 miles per Fuel Bar at 60mph or 3.9 kWh. Then, of course, use those "invisible" 13th and 14th bars, to arrive at:

2 Fuel Bars x 6 miles per Fuel Bar = 12 miles range remaining.

But, if you're going to keep driving, you need to be as precise as is possible. That #1 Fuel Bar doesn't normally extinguish when Low Battery Warning pops up. I normally reset one of the trip odometers, and keep an accurate record of how long until Very Low Battery.

Should I need to drive 12 more miles, I can be reasonably sure (again, the usual caveats) that I'll go 8 miles (at 60 mph or 3.9 kWh) in Low Battery until Very Low Battery. I should be able to make half that distance of those 8 miles, or 4 miles additionally, from VLB to Turtle.

12 miles total, just like you came up with, BUT, from the time of LB. When "Very Low Battery" pops up, it is your very last cross check as to whether you will likely make the planned range, or not.

Also, I'd recommend using a battery factor of 21 kWh.
 
gbshaun said:
...
Unfortunately the final 20 miles of my journey is potentially the fastest. I say "potentially" as, with 15 miles remaining and a display reading 19, I held back from what I'd prefer to be driving. Overly cautious?

To charge it took 22.18kW
18.13/22.18 = 81.7%

Thanks,
Shaun

You do mean your "journey is potentially the slowest", to get more range?

Also, please hit that "h" when you mean the unit of energy...nic pic I know, but when equations are involved it's the first thing to check to make sure you units are right means your math is on the right track.

That goes for you too, sir Tony ;)
 
occ said:
Also, please hit that "h" when you mean the unit of energy...nic pic I know, but when equations are involved it's the first thing to check to make sure you units are right means your math is on the right track.

That goes for you too, sir Tony ;)


I went up and edited the previous post to reflect the "h". I can't spell or do simple math :cry:
 
occ said:
gbshaun said:
...
Unfortunately the final 20 miles of my journey is potentially the fastest. I say "potentially" as, with 15 miles remaining and a display reading 19, I held back from what I'd prefer to be driving. Overly cautious?

To charge it took 22.18kW
18.13/22.18 = 81.7%

Thanks,
Shaun

You do mean your "journey is potentially the slowest", to get more range?

No, it's potentially the fastest, and when i have a shorter trip it is indeed executed at a possibly illegal speed. On days such as Tuesday, that traffic-free section of I-5 is rather wasted as I'm watching the kWh drain away fasted than i feel comfortable with, so back off.

occ said:
Also, please hit that "h" when you mean the unit of energy...nic pic I know, but when equations are involved it's the first thing to check to make sure you units are right means your math is on the right track.
Excuse my h-dropping. it's a common 'abit amongst my type!
Corrected.
 
Edit - 25 August 2011, Version 6a

If you decide to use this chart, you can print it out, and just cut off the Battery % column on the left. Lot's of changes based on user input that you can read through the thread.

If you would like a PDF or the original Excel file, just PM me.


LEAFrangeChartVersion6-1.jpg
 
This is very cool. I have a stupid question: Is the reason the battery % and distance numbers are between Fuel Bar lines because its an average between those two numbers?

For example, if you drive 40mph and you have 10 fuel bars, you will get between 88-96 miles (on a level road, no HVAC, etc, etc.)?
 
EricBayArea said:
This is very cool. I have a stupid question: Is the reason the battery % and distance numbers are between Fuel Bar lines because its an average between those two numbers?

For example, if you drive 40mph and you have 10 fuel bars, you will get between 88-96 miles (on a level road, no HVAC, etc, etc.)?

Those little numbers to the right of each range column are not an average. It's the distance you can travel in that fuel bar, in this case, 8 miles for that #10 fuel bar at 40mph (or 5.2miles/kWh for around town driving).

If you're driving down the highway at 40mph, and happen to look down and see the number 11 fuel bar disappear, leaving 10 left, you could drive 96 more miles under the same conditions. When you drive 8 more miles, the number 10 bar will disappear, and you'll have 88 miles left.

Those of us with SOC meters can actually see, for example, 81.1% battery, and see that we have 92 miles left, and fuel bar 10 will still be lighted.

One quirk, of many, is that if you were looking at the #10 fuel bar, and pulled into the local gas station at 81.1% battery for a window wash and to see how much gasoline sells for these days, when you restart your car, you most probably will not see that #10 bar. The battery level is exactly the same as when you turned off the car (again, we can still see that 81.1% with an SOC meter), but since that bar isn't completely full, it won't light up again.

So, you'll be looking at 9 bars as you continue your 40mph drive in level Kansas country roads (with no wind), but you'll get 12 miles for that #9 bar instead of 8 miles (8 miles for bar #9, and 4 miles of the non-lighted bar #10).

Is that clear enough?
 
How did you come up with the elevation change information? I ask because I have a 1,400 elevation change each way every day and it does not track with what I typically see...

Also I notice a typo: "console" is misspelled.


TonyWilliams said:
Edit - 25 August 2011, Version 6.0

If you decide to use this chart, you can print it out, and just cut off the Battery % column on the left. Lot's of changes based on user input that you can read through the thread.

If you would like a PDF or the original Excel file, just PM me.]
 
mogur said:
How did you come up with the elevation change information? I ask because I have a 1,400 elevation change each way every day and it does not track with what I typically see...

Also I notice a typo: "console"


Mostly SWAG. What do you get? I haven't done any hills with the SOC meter, but we have plenty to try.
 
Using one additional bar per thousand feet climbed seems to be about right, at least based on my observations. Keep in mind that this is in addition to whatever energy might be required to cover the distance on the flats.

Check out http://www.mynissanleaf.com/viewtopic.php?f=31&t=5315&start=20#p124074" onclick="window.open(this.href);return false;
 
Going to work, I have a 1400' elevation change downhill and about a 23 mile trip. It is mostly freeway with an average speed of probably around 45mph (high of 68 and low of stop and go). I typically use barely 2 bars going to work and 6 bars coming back. I'll have to play with the math - perhaps your ROT is about right considering the coarse granularity of the bars... When I get one of the SOCs I'll be able to tell with much more accuracy.


TonyWilliams said:
mogur said:
How did you come up with the elevation change information? I ask because I have a 1,400 elevation change each way every day and it does not track with what I typically see...

Also I notice a typo: "console"


Mostly SWAG. What do you get? I haven't done any hills with the SOC meter, but we have plenty to try.
 

Latest posts

Back
Top