Range = Miles/KWh * 21

My Nissan Leaf Forum

Help Support My Nissan Leaf Forum:

This site may earn a commission from merchant affiliate links, including eBay, Amazon, and others.

evnow

Well-known member
Joined
Apr 22, 2010
Messages
11,480
Location
Seattle, WA
Thats right.

Code:
Total Range = Miles/KWh * 21
Remaining Range = 21* kwh Used - Miles Driven
By looking at the m/kwh you are getting, you can estimate the range. This also gives us estimate range remaining, assuming the rest of the drive closely resembles the drive till now.

If you charge to 80% here is the math.

Code:
Total Range = Miles/KWh * 17 (80% charge)
Remaining Range = 17* kwh Used - Miles Driven (80% charge)
To be able to use this, reset the m/kwh and the trip odometer, after recharging.

Now, how did I get the 21 kwh ?

There are two separate independant pieces of information that point to 21 kwh.

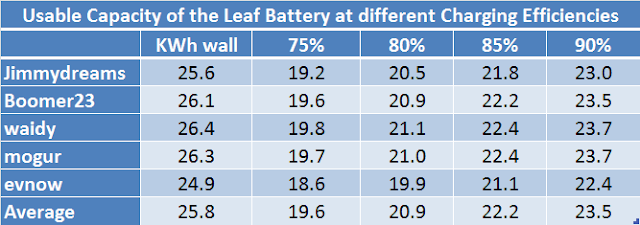
One comes from the total electricity used to recharge Leaf that has been driven atleast until turtle. Here is the list of people who have reported the total electricity used to recharge. This also gives the total "usable" energy stored in the battery after accounting for charging losses. As you can see the average is between 21 & 22, assuming an efficiency between 80 and 85%.

totalkwh.png


Second piece of information comes from the reported miles driven till turtle and the miles/kwh that the Leaf dash showed for that trip. I know of only one other person who reported that information. Using the simple formula below, we get the KWh used by Leaf till turtle.

KWh used = Miles Driven / (m/kwh).

I drove 88.6 miles @ 5.3 - starting from 80% charge. That gets me a total kwh used of 16.7 or 20.9 kwh @ 100%. boomer23 got 86.5 miles @ 4.1 m/kwh. This comes to 21.1 kwh. This is using the m/kwh shown on the central lcd console (the dash is a little lower).

All these numbers are remarkably close, considering different drivers, weather conditions and terrain.

This gives me the confidence to say that to calculate total range we should use 21 kwh (or 22 kwh if you are less conservative) as the usable capacity.
 
I get where you're going with this, and I approve.

The only two numbers with user-verifiable numbers are the Wall power consumption, and odometer.
The rest is either synthetic or known only to Nissan: SOC, battery capacity, battery consumption, current..

The SOC value on the CANbus seems to increase linearly during charge, especially the first 80%.
3-to-281-charge.png

With a bit more data, I should be able to correlate CANbus SOC to metered (wall) power, which is going to be a better power indicator than the Carwings nonsense.

If I can find the odometer/distance in the CAN data, then that's the closest thing to real-time accurate data going.
 
evnow said:
Now, how did I get the 21 kwh ?
...
There are two separate independant pieces of information that point to 21 kwh.
...
This gives me the confidence to say that to calculate total range we should use 21 kwh (or 22 kwh if you are less conservative) as the usable capacity.
If I remember correctly someone gave you these numbers over six months ago. As that someone mentioned then, there is a simple and accurate way of deriving these numbers from the EPA figures.

You might also want to edit your post to clean up your formula. You do not get kWh by multiplying miles by miles/kWh. That gives miles^2/kWh. I think you meant to multiply miles by kWh/miles.

I also don't see the practical application for the formula. A driver is more likely to know the range he's getting than the miles per kWh. No real point in calculating a number he already knows.

Finally I don't think the formula captures reality. The reality is that the average driver is not going to drive until they hit turtle mode. Calling the flatbed will ruin your day. What they're going to do is require a 15-20 mile buffer. Basically the bottom two red bars. In this case the practical range is the theoretical range minus fifteen or twenty miles.
 
SanDust said:
If I remember correctly someone gave you these numbers over six months ago.
Your memory is faulty. EPA doesn't give m/kwh that the Leaf dash shows. :twisted:

I also don't see the practical application for the formula. A driver is more likely to know the range he's getting than the miles per kWh. No real point in calculating a number he already knows.
Driver knows the m/kwh you are getting - it is shown by Leaf on the console.

Finally I don't think the formula captures reality. The reality is that the average driver is not going to drive until they hit turtle mode. Calling the flatbed will ruin your day. What they're going to do is require a 15-20 mile buffer. Basically the bottom two red bars. In this case the practical range is the theoretical range minus fifteen or twenty miles.
Important thing is to know what kind of m/kwh you need to be getting to achieve a range you want. You drive more or less aggressively using this information.
 
I think the post is very valid. We already know this information but newer drivers will not. I posted months ago that I was only getting 21 kwh and used that to predict what my range would be right down to winter freeway driving at 3.4 mpk and was able to predict within 3 miles of what my estimated range would be on a 63 mile trip.

Just as now in summer when I am getting 4-4.2 mpk

But the point is that if u know I need to go X miles u only need to average X/21 mpk to make it.

Its a lot easier to drive to make it early in the trip than it is to play catch up on the the last quarter of the charge
 
LEAFguy said:
Numbers that I have seen from ECOtality put the Blink EVSE efficiency at 85%.
Where do you see this?
There is no possible way the Blink EVSE itself is just 85% efficient at essentially connecting the Car to the Outlet.

Indeed, it would get insanely hot dissipating 15% of 3750W. To shed 560W of inefficiency, it would be dumping some serious heat out a nonexistent heatsink or fan.

I'm not even convinced the car, charger in it, or cooling system is dissipating 560W, but that's harder to verify.
 
In observing the Blink EVSE + Leaf L2 charging at the SDG&E meter, the current draw from the wall averages 3744.2 Watts during the 'bulk' charge phase.
AC-Watts-Blink.png

This is a whole-cycle average, and seems highly repeatable. (The car charging power does not change.)

There is a 1-minute ramp-up and brief (5 minute) taper at the end which I'm disregarding.

The SOC value for a deep-turtle charge went from "3" to "281" for my car, more or less linear.

The "number of seconds" for each incremental value had some variation:
Seconds-per-increment.png

Averaging 86.7 seconds per step, or 41.5 steps per hour.

From this, I would say that each 1 increment of "SOC" value represents about 90.2 Watt-hours of charge energy ("Wall watts").

This should be pretty easy to confirm with just the starting SOC value, final value (281), and SDG&E power total after each charge.
 
GroundLoop said:
LEAFguy said:
Numbers that I have seen from ECOtality put the Blink EVSE efficiency at 85%.
Where do you see this?
I saw this on one on ECOtality's or EV Projects online presentations. I looked for the source when I posted but couldn't find it right then. I'll take another look.

Edit: Found it (HTML version. Click on the link at the top to download the PowerPoint presentation)
 
An EVSE is just a big switch. It doesn't really have an efficiency rating per se and if it did, it would be near 100 percent...

LEAFguy said:
Numbers that I have seen from ECOtality put the Blink EVSE efficiency at 85%.
 
GBOT, I went on a 20 mile trip tonight all on city streets with different speed limits. So I was going between 25 and 38 mph. I hit 6.6m/kwh for those 20 miles. That would be 112 (6.6 X 17) miles on an 80% charge. It's hard to believe that the guess-o-meter is off by that much. I lost the third bar (only ten to start) at 5.5m, 4th bar at 11.0m, and the 5th bar at 18.0m traveling all about the same speed when I lost the previous two. It pretty much proved that the bars aren't linear, but have different values. Even if you look at the bars, they get wider as you go down which I believe means you get more miles with each one.
 
LEAFfan said:
GBOT, I went on a 20 mile trip tonight all on city streets with different speed limits. So I was going between 25 and 38 mph. I hit 6.6m/kwh for those 20 miles.
Wow! I've never seen a number that high. Please confirm, you are talking about the number shown in the middle of the dash aren't you? The one that looks like:
Energy Economy
Average 6.6
[===== . . . ]
. . . miles/kWh

I have to ask, because I can't imagine losing three bars in 18 miles with a number that high.

Ray
 
planet4ever said:
LEAFfan said:
GBOT, I went on a 20 mile trip tonight all on city streets with different speed limits. So I was going between 25 and 38 mph. I hit 6.6m/kwh for those 20 miles.
Wow! I've never seen a number that high. Please confirm, you are talking about the number shown in the middle of the dash aren't you? The one that looks like:
Energy Economy
Average 6.6
[===== . . . ]
. . . miles/kWh
I have to ask, because I can't imagine losing three bars in 18 miles with a number that high.
Ray

Yep! I should have clarified that. Actually, I had 6.7 but lost it. I don't use the CarWings/Nav ave. But if you use EVnow's numbers, it comes out to 112m/@80%. I lost the third bar (fifth out of 12) at 7 miles, so I'm wondering if I can get at least 8 from the next bar.
 
LEAFfan said:
GBOT, I went on a 20 mile trip tonight all on city streets with different speed limits. So I was going between 25 and 38 mph. I hit 6.6m/kwh for those 20 miles. That would be 112 (6.6 X 17) miles on an 80% charge. It's hard to believe that the guess-o-meter is off by that much. I lost the third bar (only ten to start) at 5.5m, 4th bar at 11.0m, and the 5th bar at 18.0m traveling all about the same speed when I lost the previous two. It pretty much proved that the bars aren't linear, but have different values. Even if you look at the bars, they get wider as you go down which I believe means you get more miles with each one.

20 miles / 6.6 = 3.03 kwh.

Assuming, you got uniform m/kwh (possibly only if you don't have elavation changes),
3rd bar - 5.5m - 0.83 kwh
4th bar - 5.5m - 0.83 kwh
5th bar - 7m - 1.06 kwh

If we assume 14 bars (with 2 hidden) - that gives us 1.5kwh per bar, if uniform. Doesn't look that way at all ....
 
So, I tried to recreate LEAFfan's data. Like him, I had just charged to 80%. I reset the trip mileage and the m/kWh number in the dash before I started. I ran a roughly six mile loop of city streets with speed limits of 25, 30, 35, 40, and 45, though I held my top speed to 40. I was trying to anticipate traffic signals and use 'go-pedal coasting' (make the blue pie sliver disappear where practical). I never went beyond two acceleration dots (in addition to the base dot). The outside temp, according to the car, was 88, so I was running with A/C, set at 75 degrees. My total trip was 28.0 miles.

My conclusion: It's all random! Everything is random; the bars are random, the m/kWh number is random, everything we've thought we could depend on is random.
  • My m/kWh started at 3.0 (!!) and built up very gradually to 5.2, dropping back to 5.1 on my last leg back to the house.
  • Miles per bar were all over the place:
4.5 for bar 10
7.6 for bar 9
3.7 for bar 8
6.6 for bar 7
4.2 for bar 6

The first two were pretty much what I expected, since bar 10 is only "partly full" at 80%, but after that they went bonkers. The fact that m/kWh was only at 4.3 when the 8th bar disappeared had me really discouraged as to my driving ability. But if you compare my 4.3 to LEAFfan's 6.6, and my 15.8 miles for those three bars to his 18.0, that's something else crazy.

Ray
 
planet4ever said:
My conclusion: It's all random! Everything is random; the bars are random, the m/kWh number is random, everything we've thought we could depend on is random.
What we need is to map the SOC % to the bars - someone with the CAN-Bus decoders can do it.
 
Don't know if this will help this thread, but I went from Altadena to Rosamond and back over the weekend. The distance is 69 or so miles, and I went over the Crest Highway, along the Angeles Forest to Sierra Hwy. to Rosamond Blvd to the Cathouse where I volunteer (Shameless plug for the cats). The elevation was my primary concern, so I took it easy in both directions. I got to the Cathouse in 1 hour and 45 minutes, the bars remaining were 2, and I tried to keep my usage meter below 20 the entire trip, reasoning that I had 20 KWh to use, and I needed to be below, regen, or coasting for a half hour to make it there. The trip usually takes me about 1 hour 30 minutes in an ICE if I am being gas conscious, and I take the freeways (210, 5, 14).

On the way home I was more reserved, keeping speeds below 45 for the most part (On the way up I tried to do the speed limits, most at 55 or 60) and I got home with 4 bars on the meter. I used the AC on the way home, and did try the pre-cool thing, although that seemed to turn off before we set out. The trip home also took about 1 hour 45 minutes.

I look at the time to charge to 80% as a monitor, and with 240 charging (Not public) at the wildcatzoo.org (Another shameless plug) I got to 95% or so charge in 4 hours time. When I got home, I looked at the 120v number, and it said 9 hours.

Ray, the guess o meter is pretty worthless. I want a smiley face sticker to cover it. At the interchange from the Crest highway to the 210, (On the way home) it said I had 50 miles of range.

So, the weekend drive was over 150 miles, and it cost me maybe 5-6$? Sweet! I did take a trip to Diamond Jim's Casino with a few passengers after the special event, and with the 95% charge I enjoyed the high speed 70mph freeway speed (I was a little faster than that) after all, to re-charge they say you should get it below 80%, right???

The trouble with trying to figure how far you will go according to the bars is you aren't able to figure the flat, regen, and stopping and starting factors. I was also concerned about the wind speed, Although I didn't need to be as it turned out.
 
Back
Top