Understanding Battery Condition w/o Using Leaf Spy

My Nissan Leaf Forum

Help Support My Nissan Leaf Forum:

This site may earn a commission from merchant affiliate links, including eBay, Amazon, and others.

Amazing1

Member
Joined
Nov 2, 2019
Messages
19
Location
West of Atlanta, GA
My Leaf is a 2014 with 31k and when charged using an at home Level 2 Charger it shows 99% and 75-78 miles (seems to vary, why I do not know). I have read the great advice on this Forum and since our EV is used only for local drives of way less than 75 miles roundtrip I have started trying to charge the car to somewhere between 85 and 90%.

I'm old, absolutely not technical and would simply like to have an idea as to the condition of our 24 khw battery back without having to figure out which doggle or OBDI needs to be paired with a Leaf Spy or Leaf Spy Pro. After a ton of reading thread after thread I have focused a bit on the Leaf's Energy Economy Display that apparently is similar to the "instant" MPG gauges that can be found on many newer Gas powered cars.

So, although I always drive the car with the ECO setting "OFF" and try to drive the Leaf like I would any one of my other cars, I have been getting an overall average Energy Economy Rating of 4.8 to 5.0 on my three most recent trips. Comparing these numbers to some other articles I read about folks who own Leaf's these numbers appear to be very strong and would indicate to me that the battery in our car is also in very good condition since its enabling me to achieve such high overall efficiency without driving like an old grandmother. Additionally I can tell you that on most of my trips I end up averaging 5 miles of range lost, as shown on the dashboard, to every 4.5-4.8 miles actually driven.

Do any of these numbers make sense to anyone? Without suggesting a Leaf Spy, which I understand is fantastic, what might these numbers I have presented herein suggest to some of you about the condition of our Leaf's battery pack. Looking forward to hearing what you wise folks have to say. :mrgreen:
 
You can't use the range estimator to assess the health of the battery. Just get the dongle in my signature. It WILL work if you have an android phone, and if you don't, those cost $30. You don't have to know the battery health if the car works for you, but if you want to know it, get LeafSpy Pro.
 
Amazing1 said:
and 75-78 miles (seems to vary, why I do not know).
That value varies because GOM (Guess-o-meter) on the dashboard is a useless indicator. You are best off ignoring it completely.

There is nothing present in a 2014 that will help you know exactly the condition of the battery or exactly the remaining charge available. As Leftie says, get Leaf Spy Pro if you want to know.
 
Amazing1 said:
Comparing these numbers to some other articles I read about folks who own Leaf's these numbers appear to be very strong and would indicate to me that the battery in our car is also in very good condition
There is very little connection between miles/kWh and battery condition. Certainly nothing you should use as you intended. It would be akin to concluding that you have a bigger gasoline tank because you get a higher MPG

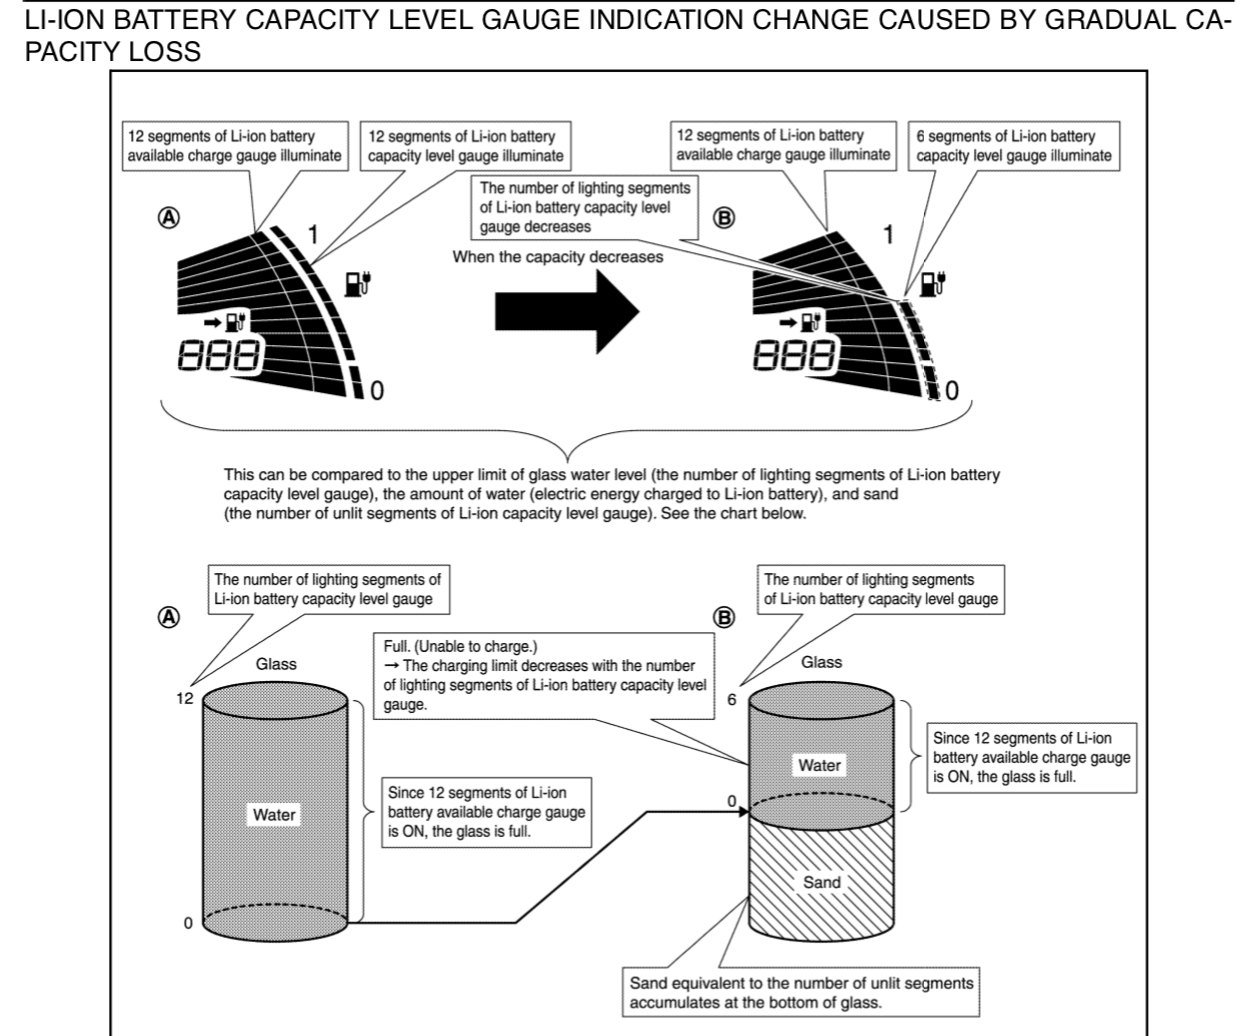
The built-in, non-LeafSpy way to know battery condition is to note how many capacity bars are lit
12/12 bars means that less than 16% of new battery capacity has been lost
After the first bar, each lost bar is ~ 6.5% of lost range

The capacity bars display is easy to find ... once you know where to look. ;)
It is labeled #15 in this graphic. Notice that it is distinct from #14, the not very granular or accurate SoC meter
Don't use the range estimate (# 13) to say anything about battery condition because it is affected by recent driving. Drive down a hill and it might show 150 miles; drive up a hill and it might show 50 miles. It can only be informative as a range remaining estimate if your recent *past* driving will be similar to your driving coming up.

uc
 
You could try driving 50-60 miles at a constant speed on flat terrain without stopping (40-50mph, not faster). Reset efficiency prior and record after run. Charge to 100% and record gom range. Divide gom range by recorded efficiency to give you approximate battery capacity. Ex. Gom=90 miles and efficiency was 4.5 miles/kWh capacity=20kWh
 
DougWantsALeaf said:
You could try driving 50-60 miles at a constant speed on flat terrain without stopping (40-50mph, not faster). Reset efficiency prior and record after run. Charge to 100% and record gom range. Divide gom range by recorded efficiency to give you approximate battery capacity. Ex. Gom=90 miles and efficiency was 4.5 miles/kWh capacity=20kWh
It does not matter how fast you drive, but you would have to be consistent.
 
It looks like you have a good healthy pack that is working just fine, and you are a good eco driver to be getting 5 miles per kWh.

Just look at the Capacity bars on the outer bar band of the "fuel" gauge. Full capacity when new it came with 12 bars; over time those will drop down, but that is the quickest, easiest way to get a feel for your Pack Condition. It's built in to the car, no need for dongles and stuff.

If you want to play around with math and numbers instead of driving, then you can convert it to approximate numbers; e.g. if you have 9 capacity bars showing then your pack capacity would be about (9/12)*24kWh = 18 kWh or about 75% of when it was new.
If you are a good driver getting 5 miles per kWh, then you might theoretically go 18kWh*5= 90 miles on a full charge. But it will be less than that on the Range Gauge because it won't let you drive it down to zero without lots of warnings... :lol:

How many capacity bars do you have showing?

9hr2Qb8.png
 
Amazing1 said:
My Leaf is a 2014 with 31k and when charged using an at home Level 2 Charger it shows 99% and 75-78 miles ...
I have been getting an overall average Energy Economy Rating of 4.8 to 5.0 on my three most recent trips. ...

The guessometer bases its guess on your most recent driving efficiency. If your driving efficiency is consistent (it seems yours is), then the guessometer can give some insight. Let's pick 77 miles range and 4.9 M/kWH as the average here. That would indicate you have about 15.7 useable kWH in your pack, about a 20% decrease from new. Under different driving conditions your efficiency will differ and thus your range. For example at highway 65mph your efficency may drop to 4.0 or less, and thus your range would be closer to 60 miles in those conditions. Subtract for bad weather, cold temperatures, etc.
 
nlspace said:
e.g. if you have 9 capacity bars showing then your pack capacity would be about (9/12)*24kWh = 18 kWh or about 75% of when it was new.
That quick calc can be a fair bit off for the casual

The first bar is 16%
The next two bars are 13%
The 4th bar can be almost used up but still lit, so up to another 6.5% loss

That adds up to as much as 35.5% loss of capacity at "9 bars." Since usable range is ~ 2.0 -- 2.5 kWh less than nominal, and casual drivers are not going to be driving much when the range estimate hits --, the practical range is miles/kWh * (24*0.645 - 2.25 - 2.5) kWh
That equals miles/kWh * 10.73 kWh
 
LeftieBiker said:
The first bar is 16%
The next two bars are 13%

I just got up, but for the 24kwh pack my recollection is 15% for the first bar, then about 6% each for the rest until the last bar, which is a bit more like 15%.
6*10+15*2 = 90
Go Fish for the other 10

Using 16% and 6.5%,
32+65 = 97
I also have to Fish, but for less ;)
 
I'm in the middle of something. Somebody please correct SB with the actual figures. I just know that what he posted was incorrect. Bar 1 is worth 15%, the 'middle' bars are worth about 6% each.
 
https://web.archive.org/web/20151108034159/http://www.electricvehiclewiki.com/Battery#Battery_Capacity_Behavior was the capacity bar table derived from the '11 service manual. It went away for '12 to '15 service manuals (reasons unknown) and I don't know if it ever came back after that. So, we don't really know if Nissan changed the mapping after that...
 
cwerdna said:
https://web.archive.org/web/20151108034159/http://www.electricvehiclewiki.com/Battery#Battery_Capacity_Behavior was the capacity bar table derived from the '11 service manual. It went away for '12 to '15 service manuals (reasons unknown) and I don't know if it ever came back after that. So, we don't really know if Nissan changed the mapping after that...

Thanks! It looks like the Gen II Leaf 1st bar is worth at least 16%.
 
Well, we don't really know what the mapping is of capacity bars to % at least on '12 to '15 Leafs. It's probably like that of the '11. Not sure about ones afterward. Maybe someone here w/access to newer service manuals can chime in.

We also don't know how that maps to what Leaf Spy renders as SOH. It seems like it's roughly capacity but we don't know for certain nor the amount of error/certainty and caveats/preconditions that are required (if any) to make it more accurate. Turbo3 has written a few times about this and other values Leaf Spy renders:
https://www.mynissanleaf.com/viewtopic.php?p=516444#p516444
https://mynissanleaf.com/viewtopic.php?p=523515#p523515
https://mynissanleaf.com/viewtopic.php?p=460369#p460369

Some of them can be verified directly (e.g. tire pressures, voltages like via https://www.mynissanleaf.com/viewtopic.php?t=17470) or reasonable certainty (e.g. temps), others w/more work and inference and for some others. not really. I pointed to some historical info about SOH and Hx at https://mynissanleaf.com/viewtopic.php?p=579357#p579357.

That said, we can and do compare notes here and elsewhere about our observations of when a bar drops vs. SOH (or other parameter(s)).
 
cwerdna said:
https://web.archive.org/web/20151108034159/http://www.electricvehiclewiki.com/Battery#Battery_Capacity_Behavior was the capacity bar table derived from the '11 service manual.

I did not notice before, but that table is actually split into 13 segments. Or put another way, the 12th bar is ~ 15%, the 1st bar is ~ 22.5%, and the middle 10 bars split the remaining 62% evenly
 
The plain fact is that observed behavior of Leafs from 2011 through 2016 (24kwh) indicates what I posted before: 15% for the first bar to drop, then roughly 6-7% each for the next 10 bars, then 15+ % for the last bar to go - something that has not yet happened, that we have seen.
 
Back
Top